Cross plot or plot cross?

I am stumped. About once a year, for the last nine years or so, I have failed to figure this out.

What could be simpler than predicting porosity from acoustic impedance? Well, lots of things, but let’s pretend for a minute that it’s easy. Here’s what you do:
1.   Measure impedance at a bunch of wells
2.   Measure the porosity — at seismic scale of course — at those wells
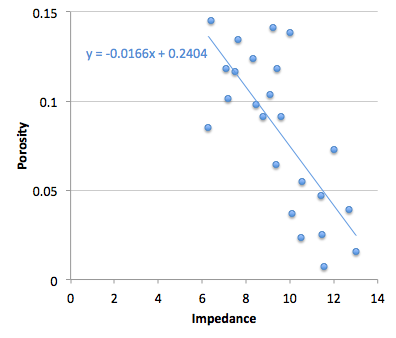
3.   Make a crossplot with porosity on the y-axis and amplitude on the x-axis
4.   Plot the data points and plot the regression line (let’s keep it linear)
5.   Find the equation of the line, which is of the form y = ax + b, or porosity = gradient × impedance + constant
6.   Apply the equation to a map (or volume, if you like) of amplitude, and Bob's your uncle.

Easy!

But, wait a minute. Is Bob your uncle after all? The parameter on the y-axis is also called the dependent variable, and that on the x-axis the independent. In other words, the crossplot represents a relationship of dependency, or causation. Well, porosity certainly does not depend on impedance — it’s the other way around. To put it another way, impedance is not the cause of porosity. So the natural relationship should put impedance, not porosity, on the y-axis. Right?
Therefore we should change some steps:

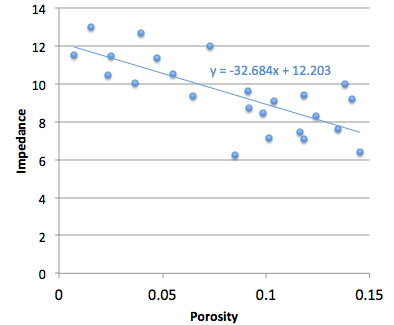
3.   Make a crossplot with impedance on the y-axis and porosity on the x-axis
4.   Plot the data points and plot the regression line
5a. Find the equation of the line, which is of the form y = ax + b, or impedance = gradient × porosity + constant
5b. Rearrange the equation for what we really want:
porosity = (impedance – constant)/gradient

Not quite as easy! But still easy.

More importantly, this gives a different answer. Bob is not your uncle after all. Bob is your aunt. To be clear: you will compute different porosities with these two approaches. So then we have to ask: which is correct? Or rather, since neither going to give us the ‘correct’ porosity, which is better? Which is more physical? Do we care about physicality?

I genuinely do not know the answer to this question. Do you?

If you're interested in playing with this problem, the data I used are from Imaging reservoir quality seismic signatures of geologic effects, report number DE-FC26-04NT15506 for the US Department of Energy by Gary Mavko et al. at Stanford University. I digitized their figure D-8; you can download the data as a CSV here. I have only plotted half of the data points, so I can use the rest as a blind test. 

Two hundred posts

The petrophysics cheasheet was one of our most popular posts

My post on Tuesday was the two hundredth post on our blog, which we started 19 months ago in November 2010. Though we began with about 15 posts per month, we have settled down to a rate of 7 or 8 posts per month, which feels sustainable. At this rate, it will be at least a year before we hit 300.

We hit 100 posts on 21 June last year, after only 222 days. In the 358 days since then we've had about 41 700 visits from 24 500 people in 152 countries. The most popular content is a little hard to gauge because of the way we run every post over the home page for a couple of weeks, but from the most recent 100 posts, the favourites are (in descending pageview order):

Someone asked recently how long our posts take to write. It varies quite a bit, especially if there are drawings or other graphics, but I think the average is about 4 hours, perhaps a little more. Posts follow an idea–draft–hack–review–publish process, and this might be months long: we currently have 52 draft posts in the pipeline! Some may never make it out...

We'd love to have some other voices on the site, so if you feel strongly about something in this field, or would like the right to reply to one of our opinion pieces, please get in touch. Or start a blog!

How big is that volume?

Sometimes you need to know how much space you need for a seismic volume. One of my machines only has 4GB of RAM, so if I don't want to run out of memory, I need to know how big a volume will be. Or your IT department might want help figuring out how much disk to buy next year.

Fortunately, since all seismic data is digital these days, it's easy to figure out how much space we will need. We simply count the samples in the volume, then account for the bit-depth. So, for example, if a 3D volume has 400 inlines and 300 traces per line, then it has 120 000 traces in total. If each trace is 6 seconds long, and the sample interval is 2 ms, then each trace has 6000/2 = 3000 samples (3001 actually, but let's not worry too much about that), so that's about 360 million samples. for a 32-bit volume, each sample requires 32/8 = 4 bytes, so we're at... a big number.  To convert to kilobytes, divide by 210, or 1024, then do it again for MB and again for GB.

It's worth noting that some seismic interpretation tools have proprietary compressed formats available for seismic data, Landmark's 'brick' format for example. This optionally applies a JPEG-like compression to reduce the file size, as well as making some sections display faster because of the way the compressed file is organized. The amount of compression depends on the frequency content of the data, and the compression is lossy, however, meaning that some of the original data is irretrievably lost in the process. If you do use such a file for visualization and interpretation, you may want to use a full bit-depth, full-fidelity file for attribute analysis. 

Do you have any tricks for managing large datasets? We'd love to hear them!

Modern illuminations

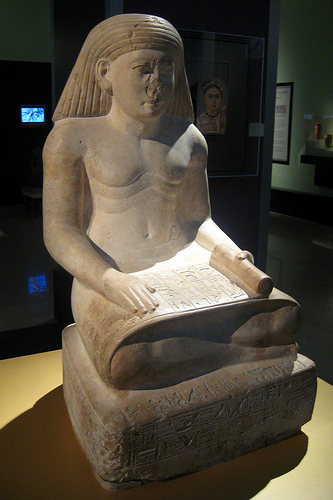
The illuminated manuscripts of the Middle Ages blended words and images, continuing traditions established by the Ancient Egyptians. Words and pictures go together: one without the other is a rather flat experience, like silent cinema, or eating fine food with a cold. This is why I like comic books so much. 

One of the opening sessions on Day 1 at the recent ScienceOnline conference was an hour with sketchnoter and überdoodler Perrin Ireland of Alphachimp Studio. She basically gave away all her secrets for purposeful scientific doodling. Tips like building a canon of fonts, practising icons and dividing lines, and honing an eye for the deft use of colour. 

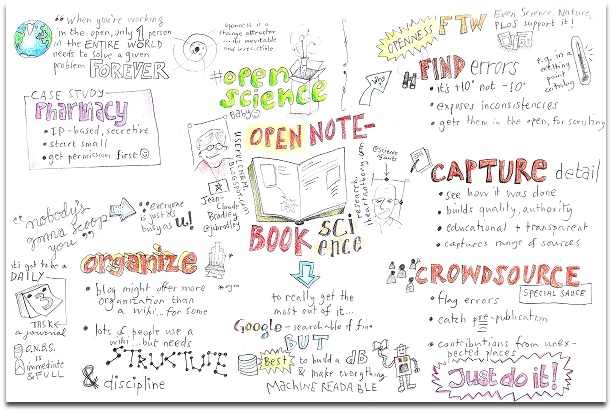
The result... well, I had a lot of fun scribing talks. Two of them I managed to get to a point we might call al dente, or maybe half baked. The first from a session on open notebook science, something that interests me quite a bit: 

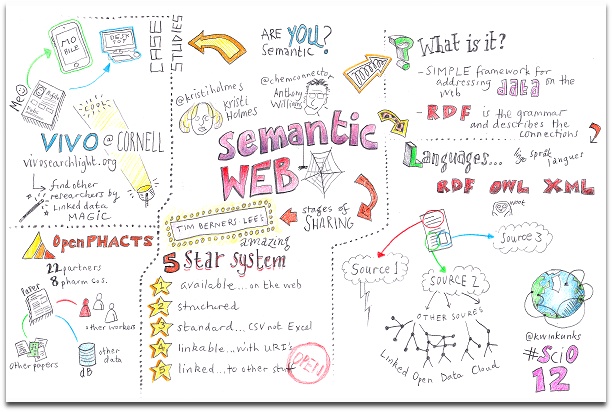
If it looks like you have to really listen and concentrate to produce one of these, that's because you do. I did miss bits, though, as I fretted over important things like what kind of robot to draw. And you might have noticed that I can't draw people. Yeah, I noticed that too. It didn't stop me adding them to the next one, from a session on the semantic web:

I'm not alone in my happiness at finding this sketchy new world. Perrin has given her perspective, and Michele Arduengo has written a lovely post about learning to draw science, and you can see many of the other efforts in this awesome Flickr gallery—the scratchings of amateurs like me sit half-convincingly alongside the professional pieces, and together I think they're rather wonderful.

Amenhotep image from Flickr user wallyg, licensed BY-NC-ND. All Flickr slideshow images are copyright of their respective creators, and may be subject to restrictions. All my work is licensed CC-BY.

Ten things I loved about ScienceOnline2012

ScienceOnline logoI spent Thursday and Friday at the annual Science Online unconference at North Carolina State University in Raleigh, NC. I had been looking forward to it since peeking in on—and even participating in—sessions last January at ScienceOnline2011. As soon as I had emerged from the swanky airport and navigated my way to the charmingly peculiar Velvet Cloak Inn I knew the first thing I loved was...

Raleigh, and NC State University. What a peaceful, unpretentious, human-scale place. And the university campus and facilities were beyond first class. I was born in Durham, England, and met my wife at university there, so I was irrationally prepared to have a soft spot for Durham, North Carolina, and by extension Raleigh too. And now I do. It's one of those rare places I've visited and known at once: I could live here. I was still basking in this glow of fondness when I opened my laptop at the hotel and found that the hard drive was doornail dead. So within 12 hours of arriving, I had...

Read More

2011 retrospective

The year is almost over so we thought we'd highlight some of our favourite and our most popular posts from the year. We've posted something like 150 or so missives to this blog this year — nothing to boast about, but when we look over our work we do feel like we've achieved something. We've made a lot of new friends and acquaintances, which has been the greatest part of it. We've also learnt a lot about geoscience, especially when we've posted things at the edges of our knowledge... luckily we don't mind learning in plain sight! 

Most popular

One of the eye-opening things about running a website is the incredible statistics available from Google Analytics. There's no personal information, of course, but where readers clicked from, what they read, and for how long, where they went next, what browser they use... and that doesn't scratch the surface. After the main page, the most popular stops are: 

After the cheatsheet posts, the most-visited posts are:

Most commented

I have not been very rigorous and filtered our own comments here—we try to respond to every comment. Except the comments about Paul Smith shoes and Breitling watches, which I delete immediately (if you don't have a blog, you are perhaps blissfully unaware of the tedious amount of robo-spam that blogs and wikis attract—lucky for you!). Apart from the Where on (Google) Earth game posts, some of the most commented posts were:

Most favourite

Evan and I have posts we loved to write and share. For what it's worth, here they are:

Evan Matt
Species identification in the rock kingdom Pseudogeophysics
The Rock Physics Workshop series Things not to think
Shattering shale Learn to program

That's it! It's almost the end of a hair-raising year for both Evan and I, and one of the most satisfying parts of it has been meeting and conversing with you, dear reader. Thank you for investing your attention in us now and then.

And have a wonderful Christmas, Newtonmas, or whatever you celebrate round your way. Cheers!

I dare you

It has taken me almost a week to decompress from the session with Seth Godin I wrote about last week. I haven't been procrastinating, just overwhelmed. The three days were full of Seth's stories; vivid, succinct, entertaining, and persuasive. The aggregate of his ideas hit me hard, in my stomach, like a swinging wrecking ball of change. Though I'm still reeling, I feel inspired to share at least a few points that are sticking. If they seem but partly formed, it's because they are.

We are creatures of inertia

We move and accelerate with linear momentum, which makes it very hard for us to turn. In fact, the more momentum we have, the more difficult it is. There is a revolution going on right now that is changing our economy and changing our lives; the connection revolution. This revolution won't last forever, maybe 15 years, and it will be marked by notions of flipping scarcity and abundance.

Strategy, skills, and caring

Any task worth doing, or innovation to be made, pulls from three sides of a triangle. Seth described that you first need a strategy; a plan, or methodology. Second, you need the skills to execute. Third, and most importantly, you need to care so much about your goal that you are willing to fail at it. A hefty portion of time was spent navigating through our preponderance of fear, and the excuses we use to convince ourselves from caring enough. I'm going to apply more of my skills to the things that deeply interest me, things that I am more likely to care a lot about. Often times, as an industry collective, or as individuals, we are afraid to destroy what is perfect in order to enable what is possible.

Ship-it

The ship-it point is the moment in time when a project is finished and it released it out into the world. Seth offered a persuasive plan that gets serious about shipping. The process of writing down your goals, and documenting your daily progress is not enough. It requires a thoughtful step by step analysis of all the factors that might get in the way. I'm going to work harder next year in going through this process, writing out my expectations by hand, and documenting my progress toward acheiving them. I will ship more in 2012.

Small, remarkable things

The food at meetings and conferences is usually not memorable, but the lunch on the last day was different. He brought in "the best thai food in New York"—one item was a best selling item not even listed on the menu. "Don't throw the plastic bowls away," he shouted to the group over lunch, "I'll be taking them home to wash and return them." Well, I made sure to eat every last morsel in my bowl, not only because it was delicious, but I couldn't stand the thought of Seth having to scrape my bowl clean in his kitchen sink! That was just one of the many small gestures, that were remarkable, and it was heartwarming. 

And another thing that sticks, were the nametags that he printed up. My first name is printed in large bold font, and in parentheses undernearth, I dare you.

Where are you headed?

Read this book!I am sitting in the Halifax airport waiting to board my plane to New York. I'm going to a different kind of conference, er... course, er... workshop. In fact I don't really know what to call it. Maybe it is a class. A three-day class for getting stuff done, for getting moving.

Myself and 60 other participants will be spending a three-day session with Seth Godin. Seth is an entrepreneur, a best-selling author of 14 books, and a self-proclaimed agent of change. Matt and I are both avid daily readers of his blog, which, judging by its immense popularity, you might be too (to find it you need only type 'seth' into Google). I am surprised by how often his writing and his teaching feels relevant to what Matt and I are trying to do at Agile*. Relevant to professionalism, to spreading ideas, to doing necessary work.

I cannot contain my excitement... and I am a little scared. It's strange meeting someone who I know a bit about, whose words I read every day, but who knows nothing about me. I was told that about 500 people applied to attend this event, but fewer than 70 got the chance to buy a ticket. As sort of a personal manifesto, I decided to share my application here. If nothing else, it is a proclamation of how I have come to see myself, and where I wish to head. Admittedly, Seth probably doesn't care too much about the details of my technical expertise, but I thought he certainly would care about our approach to business, communication, and connecting. This is what I shared with him to get in, so might as well share it here. In his characteristically cut-to-the-chase vein, he asked only two questions:

What do you do? (in 100 words or less)

I am a consultant who does geology, geophysics, and 3D computer modeling for energy companies. I am partnered with another guy and we have formed a renegade start-up, bootstrapping a business venture together. We both work remotely from small towns in Nova Scotia and are experimenting with new media approaches for connecting our industry.

My work is a blend of billable contract work and open knowledge sharing.

We blog about things that interest us in science, geology, and the energy industry. We make science apps for mobile devices for knowledge sharing and spreading ideas. We also curate an all-access wiki for underground science. We are also compiling a book that will be crowd sourced from industry experts.

Where are you headed? (Most important question, what can I help you do?)

Mine is an industry where innovation happens slowly, yet it is one of the most technologically and computationally advanced fields. Change is discouraged by corporate hierarchies getting in the way of progress.

I want to better understand my role in this revolution. I have the freedom and flexibility to implement ideas, and I am building the courage and insight to be positively disruptive.

I am an advocate of openness and sharing, especially when it comes to applied science. I want to explore how deep our market is, because knowledge sharing should be done by scientists, not by IT departments.

We've been hacking away for about 10 months with many projects on the go. Some of them will be revenue generating, some of them will be attention generating, some of them will fail. You can help by giving perspectives, spotting points of resistance with my projects, how to know when I am stretching too thin, and how my work can be even more creative.

Being a technology geek and consultant it is humbling to read the bios of some of the other people starting a movement, actualizing inspiration. I am certainly going to be the only petroleum geophysicist there. Other attendees include a physicist studying organization behaviour at Google, an economist at the US national defence fund, a women's rights social entrepreneur, and one of the founders of Tom's shoes. People, strangers from different businesses and different niche’s coming together to create something. Breathe the same air, share the same joys and fears of a precious opportunity that lay ahead. What a crazy idea. I love it. Exposing what we are good at to the world.

I have no idea what to expect, it is already surreal, and I can hardly wait.

Giftological and giftophysical goodness

The giving season cometh — are you angling for a lump of coal again? Coal balls — for the geologist who has been extra good this year. How do you measure geological goodness anyway? Number of samples taken maybe, or papers written, talks presented, blog posts posted, students instructed, children impressed with the volcano–earthquake–dinosaur trifecta.

If you're looking for things to light up a geo-nerd you care for, here are some ideas.

Comestibles

  • Single malt whisky comes from Scotland, like water, rocks, and tough folk. What could be more geoloigcal? Don't know where to start? Look out for Bruichladdich ROCKS.
  • The SoCal Beer Company brews a nice-looking Seismic IPA but <cry> I can't find a shipper.
  • There's always chocolate pebbles, or Brighton Rock.

Gadgets

T-shirts

If the geos you know just like to read, keep them quiet with our reading list. If you're still stuck, there are lots more ideas in last year's giftology post — that Triceratops is still for sale!

Rock sweets image from flickr user su-lin and licensed CC-BY-NC-ND. Low-res T-shirt image considered fair use. 

Where on (Google) Earth #315

After a long break from this awesome game, I got WoGE #314 by simple recognition. I've never been to Florida, but have scoured the whole region looking for interesting modern analogs. So I have the honour of turning in the next edition; the time is 1100 ADT, 1400 GMT, or 44-07-07 ∇ 14:19:14 Lunar Standard Time. In case you're on the moon.

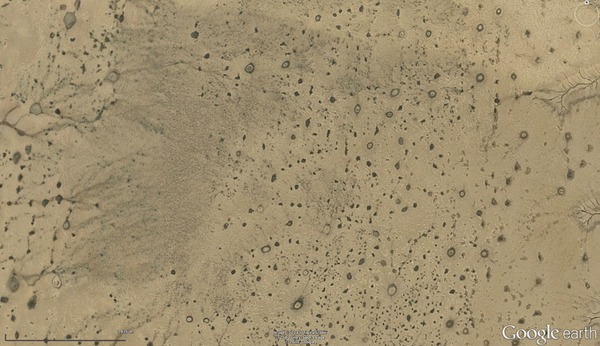
Where on (Google) Earth is the best way to tour the virtual globe since the mighty View-Master. If you are new to the game, fear not, it is easy to play. The winner is the first person to examine the picture below, find the location (name, link, or lat-long), and give a brief explanation of its geological interest. Please post your answer in the comments. And thanks to the Schott Rule, which I am invoking, newbies have a slight edge: previous winners must wait one earth hour for each win before playing—with a maximum of 48 (yes, some people are quite good at this game).

So: where and what the Dickens is this?