Please sir, may I have some processing products?

Just like your petrophysicist, your seismic processor has some awesome stuff that you want for your interpretation. She has velocities, fold maps, and loads of data. For some reason, processors almost never offer them up — you have to ask. Here is my processing product checklist:

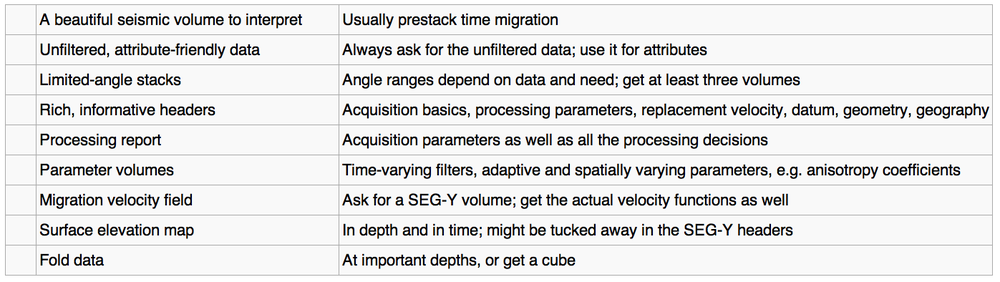
A beautiful seismic volume to interpret. Of course you need a volume to tie to wells and pick horizons on. These days, you usually want a prestack time migration. Depth migration may or may not be something you want to pay for. But there's little point in stopping at poststack migration because if you ever want to do seismic analysis (like AVO for example), you're going to need a prestack time migration. The processor can smooth or enhance this volume if they want to (with your input, of course). 

Unfiltered, attribute-friendly data. Processors like to smooth things with filters like fxy and fk. They can make your data look nicer, and easier to pick. But they mix traces and smooth potentially important information out—they are filters after all. So always ask for the unfiltered data, and use it for attributes, especially for computing semblance and any kind of frequency-based attribute. You can always smooth the output if you want.

Limited-angle stacks. You may or may not want the migrated gathers too—sometimes these are noisy, and they can be cumbersome for non-specialists to manipulate. But limited-angle stacks are just like the full stack, except with fewer traces. If you did prestack migration they won't be expensive, get them exported while you have the processor's attention and your wallet open. Which angle ranges you ask for depends on your data and your needs, but get at least three volumes, and be careful when you get past about 35˚ of offset. 

Rich, informative headers. Ask to see the SEG-Y file header before the final files are generated. Ensure it contains all the information you need: acquisition basics, processing flow and parameters, replacement velocity, time datum, geometry details, and geographic coordinates and datums of the dataset. You will not regret this and the data loader will thank you.

Processing report. Often, they don't write this until they are finished, which is a shame. You might consider asking them to write up a shared Google Docs or a private wiki as they go. That way, you can ensure you stay engaged and informed, and can even help with the documentation. Make sure it includes all the acquisition parameters as well as all the processing decisions. Those who come after you need this information!

Parameter volumes. If you used any adaptive or spatially varying parameters, like anisotropy coefficients for example, make sure you have maps or volumes of these. Don't forget time-varying filters. Even if it was a simple function, get it exported as a volume. You can visualize it with the stacked data as part of your QC. Other parameters to ask for are offset and azimuth diversity.

Migration velocity field (get to know velocities). Ask for a SEG-Y volume, because then you can visualize it right away. It's a good idea to get the actual velocity functions as well, since they are just small text files. You may or may not use these for anything, but they can be helpful as part of an integrated velocity modeling effort, and for flagging potential overpressure. Use with care—these velocities are processing velocities, not earth measurements.

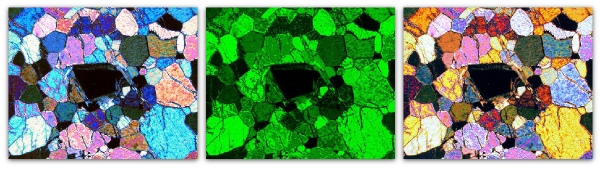
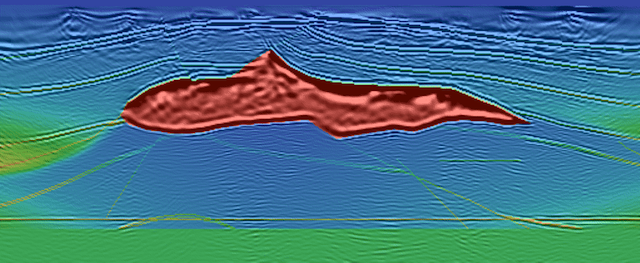
The SEG's salt model, with velocities. Image:Sandia National Labs.Surface elevation map. If you're on land, or the sea floor, this comes from the survey and should be very reliable. It's a nice thing to add to fancy 3D displays of your data. Ask for it in depth and in time. The elevations are often tucked away in the SEG-Y headers too—you may already have them.

Fold data. Ask for fold or trace density maps at important depths, or just get a cube of all the fold data. While not as illuminating as illumination maps, fold is nevertheless a useful thing to know and can help you make some nice displays. You should use this as part of your uncertainty analysis, especially if you are sending difficult interpretations on to geomodelers, for example. 

I bet I have missed something... is there anything you always ask for, or forget and then have to extract or generate yourself? What's on your checklist?

Bring it into time

A student competing in the AAPG's Imperial Barrel Award recently asked me how to take seismic data, and “bring it into depth”. How I read this was, “how do I take something that is outside my comfort zone, and make it fit with what is familiar?” Geologists fear the time domain. Geology is in depth, logs are in depth, drill pipe is in depth. Heck, even X and Y are in depth. Seismic data relates to none of those things; useless right? 

It is excusable for the under-initiated, but this concept of “bringing [time domain data] into depth” is an informal fallacy. Experienced geophysicists understand this because depth conversion, in all of its forms and derivatives, is a process that introduces a number of known unknowns. It is easier for others to be dismissive, or ignore these nuances. So early-onset discomfort with the travel-time domain ensues. It is easier to stick to a domain that doesn’t cause such mental backflips; a kind of temporal spatial comfort zone. 

Linear in time

However, the unconverted should find comfort in one property where the time domain is advantageous; it is linear. In contrast, many drillers and wireline engineers are quick to point that measured depth is not nessecarily linear. Perhaps time is an even more robust, more linear domain of measurement (if there is such a concept). And, as a convenient result, a world of possibilities emerge out of time-linearity: time-series analysis, digital signal processing, and computational mathematics. Repeatable and mechanical operations on data.

Boot camp in time

The depth domain isn’t exactly omnipotent. A colleague, who started her career as a wireline-engineer at Schlumberger, explained to me that her new-graduate training involved painfully long recitations and lecturing on the intricacies of depth. What is measured depth? What is true vertical depth? What is drill-pipe stretch? What is wireline stretch? And so on. Absolute depth is important, but even with seemingly rigid sections of solid steel drill pipe, it is still elusive. And if any measurement requires a correction, that measurement has error. So even working in the depth domain data has its peculiarities.

Few of us ever get the privilege of such rigorous training in the spread of depth measurements. Sitting on the back of the rhetorical wireline truck, watching the coax-cable unpeel into the wellhead. Few of us have lifted a 300 pound logging tool, to feel the force that it would impart on kilometres of cable. We are the recipients of measurements. Either it is a text file, or an image. It is what it is, and who are we to change it? What would an equvialent boot camp for travel-time look like? Is there one?

In the filtered earth, even the depth domain is plastic. Travel-time is the only absolute.

More than a blueprint

blueprint_istock.jpg
"This company used to function just fine without any modeling."

My brother, an architect, paraphrased his supervisor this way one day; perhaps you have heard something similar. "But the construction industry is shifting," he noted. "Now, my boss needs to see things in 3D in order to understand. Which is why we have so many last minute changes in our projects. 'I had no idea that ceiling was so low, that high, that color, had so many lights,' and so on."

The geological modeling process is often an investment with the same goal. I am convinced that many are seduced by the appeal of an elegantly crafted digital design, the wow factor of 3D visualization. Seeing is believing, but in the case of the subsurface, seeing can be misleading.

Not your child's sandbox! Photo: R Weller.

Not your child's sandbox! Photo: R Weller.

Building a geological model is fundamentally different than building a blueprint, or at least it should be. First of all, a geomodel will never be as accurate as a blueprint, even after the last well has been drilled. The geomodel is more akin to the apparatus of an experiment; literally the sandbox and the sand. The real lure of a geomodel is to explore and evaluate uncertainty. I am ambivalent about compelling visualizations that drop out of geomodels, they partially stand in the way of this high potential. Perhaps they are too convincing.

I reckon most managers, drillers, completions folks, and many geoscientists are really only interested in a better blueprint. If that is the case, they are essentially behaving only as designers. That mindset drives a conflict any time the geomodel fails to predict future observations. A blueprint does not have space for uncertainty, it's not defined that way. A model, however, should have uncertainty and simplifying assumptions built right in.

Why are the narrow geological assumptions of the designer so widely accepted and in particular, so enthusiastically embraced by the industry? The neglect of science keeping up with technology is one factor. Our preference for simple and quickly understood explanations is another. Geology, in its wondrous complexity, does not conform to such easy reductions.

Despite popular belief, this is not a blueprint.We gravitate towards a single solution precisely because we are scared of the unknown. Treating uncertainty is more difficult that omitting it, and a range of solutions is somehow less marketable than precision (accuracy and precision are not the same thing). It is easier because if you have a blueprint, rigid, with tight constraints, you have relieved yourself from asking what if?

  • What if the fault throw was 20 m instead of 10 m?
  • What if the reservoir was oil instead of water?
  • What if the pore pressure increases downdip?

The geomodelling process should be undertaken for the promise of invoking questions. Subsurface geoscience is riddled with inherent uncertainties, uncertainties that we aren't even aware of. Maybe our software should have a steel-blue background turned on as default, instead of the traditional black, white, or gray. It might be a subconscious reminder that unless you are capturing uncertainty and iterating, you are only designing a blueprint.

If you have been involved with building a geologic model, was it a one-time rigid design, or an experimental sandbox of iteration?

The photograph of the extensional sandbox experiment is used with permission from Roger Weller of Cochise College. Image of geocellular model from the MATLAB Reservoir Simulation Toolbox (MRST) from SINTEF applied mathematics, which has been recently released under the terms of the GNU General public license! The blueprint is © nadla and licensed from iStock. None of these images are subject to Agile's license terms.

Open up

After a short trip to Houston, today I am heading to London, Ontario, for a visit with Professor Burns Cheadle at the University of Western Ontario. I’m stoked about the trip. On Saturday I’m running my still-developing course on writing for geoscientists, and tomorrow I’m giving the latest iteration of my talk on openness in geoscience. I’ll post a version of it here once I get some notes into the slides. What follows is based on the abstract I gave Burns.

A recent survey by APEGBC's Innovation magazine revealed that geoscience is not among the most highly respected professions. Only 20% of people surveyed had a ‘great deal of respect’ for geologists and geophysicists, compared to 30% for engineers, and 40% for teachers. This is far from a crisis, but as our profession struggles to meet energy demands, predict natural disasters, and understand environmental change, we must ask, How can we earn more trust? Perhaps more openness can help. I’m pretty sure it can’t hurt.

Many people first hear about ‘open’ in connection with software, but open software is just one point on the open compass. And even though open software is free, and can spread very easily in principle, awareness is a problem—open source marketing budgets are usually small. Open source widgets are great, but far more powerful are platforms and frameworks, because these allow geoscientists to focus on science, not software, and collaborate. Emerging open frameworks include OpendTect and GeoCraft for seismic interpretation, and SeaSeis and BotoSeis for seismic processing.

If open software is important for real science, then open data are equally vital because they promote reproducibility. Compared to the life sciences, where datasets like the Human Genome Project and Visible Human abound, the geosciences lag. In some cases, the pieces exist already in components like government well data, the Open Seismic Repository, and SEG’s list of open datasets, but they are not integrated or easy to find. In other cases, the data exist but are obscure and lack a simple portal. Some important plays, of global political and social as well as scientific interest, have little or no representation: industry should release integrated datasets from the Athabasca oil sands and a major shale gas play as soon as possible.

Open workflows are another point, because they allow us to accelerate learning, iteration, and failure, and thus advance more quickly. We can share easily but slowly and inefficiently by publishing, or attending meetings, but we can also write blogs, contribute to wikis, tweet, and exploit the power of the internet as a dynamic, multi-dimensional network, not just another publishing and consumption medium. Online readers respond, get engaged, and become creators, completing the feedback loop. The irony is that, in most organizations, it’s easier to share with the general public, and thus competitors, than it is to share with colleagues.

The fourth point of the compass is in our attitude. An open mindset recognizes our true competitive strengths, which typically are not our software, our data, or our workflows. Inevitably there are things we cannot share, but there’s far more that we can. Industry has already started with low-risk topics for which sharing may be to our common advantage—for example safety, or the environment. The question is, can we broaden the scope, especially to the subsurface, and make openness the default, always asking, is there any reason why I shouldn’t share this?

In learning to embrace openness, it’s important to avoid some common misconceptions. For example, open does not necessarily mean free-as-in-beer. It does not require relinquishing ownership or rights, and it is certainly not the same as public domain. We must also educate ourselves so that we understand the consequences of subtle and innocuous-seeming clauses in licences, for example those pertaining to non-commerciality. If we can be as adept in this new language as many of us are today in intellectual property law, say, then I believe we can accelerate innovation in energy and build trust among our public stakeholders.

So what are you waiting for? Open up!

Ten things I loved about ScienceOnline2012

ScienceOnline logoI spent Thursday and Friday at the annual Science Online unconference at North Carolina State University in Raleigh, NC. I had been looking forward to it since peeking in on—and even participating in—sessions last January at ScienceOnline2011. As soon as I had emerged from the swanky airport and navigated my way to the charmingly peculiar Velvet Cloak Inn I knew the first thing I loved was...

Raleigh, and NC State University. What a peaceful, unpretentious, human-scale place. And the university campus and facilities were beyond first class. I was born in Durham, England, and met my wife at university there, so I was irrationally prepared to have a soft spot for Durham, North Carolina, and by extension Raleigh too. And now I do. It's one of those rare places I've visited and known at once: I could live here. I was still basking in this glow of fondness when I opened my laptop at the hotel and found that the hard drive was doornail dead. So within 12 hours of arriving, I had...

Read More

The filtered earth

Ground-based image (top left) vs Hubble's image. Click for a larger view. One of the reasons for launching the Hubble Space Telescope in 1990 was to eliminate the filter of the atmosphere that affects earth-bound observations of the night sky. The results speak for themselves: more than 10 000 peer-reviewed papers using Hubble data, around 98% of which have citations (only 70% of all astronomy papers are cited). There are plenty of other filters at work on Hubble's data: the optical system, the electronics of image capture and communication, space weather, and even the experience and perceptive power of the human observer. But it's clear: eliminating one filter changed the way we see the cosmos.

What is a filter? Mathematically, it's a subset of a larger set. In optics, it's a wavelength-selection device. In general, it's a thing or process which removes part of the input, leaving some output which may or may not be useful. For example, in seismic processing we apply filters which we hope remove noise, leaving signal for the interpreter. But if the filters are not under our control, if we don't even know what they are, then the relationship between output and input is not clear.

Imagine you fit a green filter to your petrographic microscope. You can't tell the difference between the scene on the left and the one on the right—they have the same amount and distribution of green. Indeed, without the benefit of geological knowledge, the range of possible inputs is infinite. If you could only see a monochrome view, and you didn't know what the filter was, or even if there was one, it's easy to see that the situation would be even worse. 

Like astronomy, the goal of geoscience is to glimpse the objective reality via our subjective observations. All we can do is collect, analyse and interpret filtered data, the sifted ghost of the reality we tried to observe. This is the best we can do. 

What do our filters look like? In the case of seismic reflection data, the filters are mostly familiar: 

  • the design determines the spatial and temporal resolution you can achieve
  • the source system and near-surface conditions determine the wavelet
  • the boundaries and interval properties of the earth filter the wavelet
  • the recording system and conditions affect the image resolution and fidelity
  • the processing flow can destroy or enhance every aspect of the data
  • the data loading process can be a filter, though it should not be
  • the display and interpretation methods control what the interpreter sees
  • the experience and insight of the interpreter decides what comes out of the entire process

Every other piece of data you touch, from wireline logs to point-count analyses, and from pressure plots to production volumes, is a filtered expression of the earth. Do you know your filters? Try making a list—it might surprise you how long it is. Then ask yourself if you can do anything about any of them, and imagine what you might see if you could. 

Hubble image is public domain. Photomicrograph from Flickr user Nagem R., licensed CC-BY-NC-SA. 

What do you mean by average?

I may need some help here. The truth is, while I can tell you what averages are, I can't rigorously explain when to use a particular one. I'll give it a shot, but if you disagree I am happy to be edificated. 

When we compute an average we are measuring the central tendency: a single quantity to represent the dataset. The trouble is, our data can have different distributions, different dimensionality, or different type (to use a computer science term): we may be dealing with lognormal distributions, or rates, or classes. To cope with this, we have different averages. 

Arithmetic mean

Everyone's friend, the plain old mean. The trouble is that it is, statistically speaking, not robust. This means that it's an estimator that is unduly affected by outliers, especially large ones. What are outliers? Data points that depart from some assumption of predictability in your data, from whatever model you have of what your data 'should' look like. Notwithstanding that your model might be wrong! Lots of distributions have important outliers. In exploration, the largest realizations in a gas prospect are critical to know about, even though they're unlikely.

Geometric mean

Like the arithmetic mean, this is one of the classical Pythagorean means. It is always equal to or smaller than the arithmetic mean. It has a simple geometric visualization: the geometric mean of a and b is the side of a square having the same area as the rectangle with sides a and b. Clearly, it is only meaningfully defined for positive numbers. When might you use it? For quantities with exponential distributions — permeability, say. And this is the only mean to use for data that have been normalized to some reference value. 

Harmonic mean

The third and final Pythagorean mean, always equal to or smaller than the geometric mean. It's sometimes (by 'sometimes' I mean 'never') called the subcontrary mean. It tends towards the smaller values in a dataset; if those small numbers are outliers, this is a bug not a feature. Use it for rates: if you drive 10 km at 60 km/hr (10 minutes), then 10 km at 120 km/hr (5 minutes), then your average speed over the 20 km is 80 km/hr, not the 90 km/hr the arithmetic mean might have led you to believe. 

Median average

The median is the central value in the sorted data. In some ways, it's the archetypal average: the middle, with 50% of values being greater and 50% being smaller. If there is an even number of data points, then its the arithmetic mean of the middle two. In a probability distribution, the median is often called the P50. In a positively skewed distribution (the most common one in petroleum geoscience), it is larger than the mode and smaller than the mean:

Mode average

The mode, or most likely, is the most frequent result in the data. We often use it for what are called nominal data: classes or names, rather than the cardinal numbers we've been discussing up to now. For example, the name Smith is not the 'average' name in the US, as such, since most people are called something else. But you might say it's the central tendency of names. One of the commonest applications of the mode is in a simple voting system: the person with the most votes wins. If you are averaging data like facies or waveform classes, say, then the mode is the only average that makes sense. 

Honourable mentions

Most geophysicists know about the root mean square, or quadratic mean, because it's a measure of magnitude independent of sign, so works on sinusoids varying around zero, for example. 

The root mean square equation

Finally, the weighted mean is worth a mention. Sometimes this one seems intuitive: if you want to average two datasets, but they have different populations, for example. If you have a mean porosity of 19% from a set of 90 samples, and another mean of 11% from a set of 10 similar samples, then it's clear you can't simply take their arithmetic average — you have to weight them first: (0.9 × 0.21) + (0.1 × 0.14) = 0.20. But other times, it's not so obvious you need the weighted sum, like when you care about the perception of the data points

Are there other averages you use? Do you see misuse and abuse of averages? Have you ever been caught out? I'm almost certain I have, but it's too late now...

There is an even longer version of this article in the wiki. I just couldn't bring myself to post it all here. 

Petroleum cheatsheet

I have just finished teaching one semester of Petroleum Geoscience at Dalhousie University. It's not quite over: I am still marking, marking, marking. The experience was all of the following, mostly simultaneously:

  • scarily exposing
  • surprisngly eye-opening
  • deeply exhausting
  • personally motivating
  • professionally educational
  • ultimately satisying
  • predominantly fun

Lucrative? No, but I did get paid. Regrettable? No, I'm very happy that I did it. I'm not certain I'd do it again... perhaps if it was the very same course, now that I have some material to build on. 

One of the things I made for my students was a cheatsheet. I'd meant to release it into the wild long ago, but I'm pleased to say that today I have tweaked and polished and extended it and it's ready. There will doubtless be updates as our cheatsheet faithful expose my schoolboy errors (please do!), but version 1.0 is here, still warm from the Inkscape oven.

This is the fifth cheatsheet in our collection. If you find a broken link, do let us know, as I have moved them into a new folder today. Enjoy!

Things not to think

  1. Some humans are scientists.
  2. No non-humans are scientists.
  3. Therefore, scientists are human.

That's how scientists think, right? Logical, deductive, objective, algorithmic. Put in such stark terms, this may seem over the top, but I think scientists do secretly think of themselves this way. Our skepticism makes us immune to the fanciful, emotional, naïvetés that normal people believe. You can't fool a scientist!

Except of course you can. Just like everyone else, scientists' intuition is flawed, infested with bias like subjectivity and the irresistible need to seek confirmation of hypotheses. I say 'everyone', but perhaps scientists are biased in obscure, profound ways that non-specialists are not. A scary thought.

But sometimes I hear scientists say things that are especially subtle in their wrongness. Don't get me wrong: I wholeheartedly believe these things too, until I stop for a moment and reflect. Here are some examples:

The scientific method

...as if there is but one method. To see how wrong this notion is, stop and try to write down how your own investigations proceed. The usual recipe is something like: question, hypothesis, experiment, adjust hypothesis, iterate, and conclude with a new theory. Now look at your list and ask yourself if that's really how it goes. If it isn't really full of false leads, failed experiments, random shots in the dark and a brain fart or two. Or maybe that's just me.

If not thesis then antithesis

...as if there is no nuance or uncertainty in the world. We treat bipolar disorder in people, but seem to tolerate it and even promote it in society. Arguments quickly move to the extremes, becoming ludicrously over-simplified in the process. Example: we need to have an even-tempered, fact-based discussion about our exploitation of oil and gas, especially in places like the oil sands. This discussion is difficult to have because if you're not with 'em, you're against 'em. 

Nature follows laws

...as if nature is just a good citizen of science. Without wanting to fall into the abyss of epistemology here, I think it's important to know at all times that scientists are trying to describe and represent nature. Thinking that nature is following the laws that we derive on this quest seems to me to encourage an unrealistically deterministic view of the world, and smacks of hubris.

How vivid is the claret, pressing its existence into the consciousness that watches it! If our small minds, for some convenience, divide this glass of wine, this universe, into parts — physics, biology, geology, astronomy, psychology, and so on — remember that Nature does not know it!
Richard Feynman

Science is true

...as if knowledge consists of static and fundamental facts. It's that hubris again: our diamond-hard logic and 1024-node clusters are exposing true reality. A good argument with a pseudoscientist always convinces me of this. But it's rubbish—science isn't true. It's probably about right. It works most of the time. It's directionally true, and that's the way you want to be going. Just don't think there's a True Pole at the end of your journey.

There are probably more but I read or hear and example of at least one of these a week. I think these fallacies are a class of cognitive bias peculiar to scientists. A kind of over-endowment of truth. Or perhaps they are examples of a rich medley of biases, each of us with our own recipe. Once you know your recipe and learned its smell, be on your guard!

The simultaneity funnel

Is your brilliant idea really that valuable?

At Agile*, we don't really place a lot of emphasis on ideas. Ideas are abundant, ideas are cheap. Ideas mean nothing without actions. And it's impossible to act on every one. Funny though, I seem to get enthralled whenever I come up with a new idea. It's conflicting because, it seems to me at least, a person with ideas is more valuable, and more interesting, than one without. Perhaps it takes a person who is rich with ideas to be able to execute. Execution and delivery is rare, and valuable. 

Kevin Kelly describes the evolution of technology as a progression of the inevitable, quoting examples such as the lightbulb, and calculus. Throughout history parallel invention is the norm. 

We can say, the likelihood that the lightbulb will stick is 100 percent. The likelihood Edison's was the adopted bulb is, well, one in 10,000. Furthermore, each stage of the incarnation can recruit new people. Those toiling at the later stages may not have been among the early pioneers. Given the magnitude of the deduction, it is improbable that the first person to make an invention stick was also the first person to think of the idea.

Danny Hillis, founder of Applied Minds describes this as an inverted pyramid of invention. It tells us that your brilliant idea will have coparents. Even though the final design of the first marketable lightbulb could not have been anticipated by anyone, the concept itself was inevitable. All ideas start out abstract and become more specific toward their eventual execution. 

Does this mean that it takes 10,000 independant tinkerers to bring about an innovation? We aren't all working on the same problems at the same time, and some ideas arrive too early. One example is how microseismic monitoring of reservoir stimulation has exploded recently with the commercialization of shale gas projects in North America. The technology came from earthquake detection methods and that has been around for decades. Only recently has this idea been utilized in the petroleum industry, due to an alignment of compelling market forces. 

So is innovation merely a numbers game? Is 10,000 a critical mass that must be exceeded to bring about a single change? If so, the image of the lonely hero-inventor-genius, then, is misguided. And if it is a numbers game, then subsurface oil and gas technology could be seriously challenged. The SPE has nearly 100,000 members world wide, compared to our beloved SEG, which has a mere 6,000 33,000. Membership to a club or professional society does not equate to contribution, but if this figure is correct, I doubt our industry has the sustained man power to feed this funnel.

This system has been observed since the start of recorded science. The pace of invention is accelerating with population and knowledge growth. Additionally, even though the pace of technology is accelerating, so is specialization and diversification, which means we have fewer people working on more problems. Is knowledge sharing and crowd wisdom a natural supplement to this historical phenomenon? Are we augmenting this funnel or connecting disparate funnels when we embrace openess?

A crowded funnel might be compulsory for advacement and progression even if it is causes cutthroat competitiveness, hoarding, or dropping out altogether. But if these options become no longer palatable for the future of our industry, we will have to modify our approach.