Potash mine photo tour

On Friday, Matt and I went on a tour of the PCS potash mine in Penobsquis, New Brunswick, as a precursor to the 2011 Atlantic Geoscience Society Colloquium in Fredericton.

The evaporites of the Early Carboniferous Windsor Group were formed as a result of two marine incursions into an otherwise clastic red bed sequence within the Moncton sub-basin. The evaporites containing the potash ore have been folded into a NE-SW trending anticline as shown in the diagram below.

Brian Roulston hosted 24 visitors into the mine. We were lowered about 400 m down to the main workings then driven approximately 10 km underground to three main attractions: a cavern stope in the Basal Halite; an active stope in the halite; finally an active stope in the potash ore (sylvinite).

Thanks to Brian and his team at PCS for putting this tour together for us, it was so much fun.

Signage

People

Gear

Salts, rusts, colors, and textures 

Darkness

Mining the ore

Measuring value

Often in upstream oil and gas we are challenged with a simple question: what's the value? What's the value of that 3D seismic? What's the NPV of this study? How does your professional network affect our bottom line?

Sometimes, at least for me, the first reaction is indignation. Let's take the seismic example; it goes like this:

Finance guy - So, this $28M... 3D seismic. What's the value of this data set?
Geoscientist - What's the value? Of that 3D? That state-of-the-art, high-fold, wide-azimuth, long-offset, high-bandwidth, eco-friendly, ultra-safe 3D seismic survey I just spent four months designing and soliciting bids on?
Finance guy - Yeah
Geoscientist - We have four wells on twenty square kilometres of land. We want to drill forty more. The wells cost $10M each. The seismic will allow us to pick the best locations. It's 3D seismic, the best quality. We always do it. Everyone does it. We can't do subsurface science without it, not very well anyway.
Finance guy - Yeah... Sorry, what's the value of the seismic? Dollars will do.

Finance guy just wants a number. The value is clear to everyone involved. But maybe money is tight this year and finance would like to defer some costs to next year. Maybe we can lower the cost by making the survey smaller, or reducing the fold. Before too long someone utters the unspeakable: 'Value of Information'. The next month of your life becomes a frustrating spreadsheet nightmare of trying to get the process to yield the answer your team wants so you can get on with finding oil and gas.

I think there is a better way. What do you think?

The Agile* interpreter's canon

There are only two types of interpretation: those that have been revised and those that need to be.
Don Herron

As Matt mentioned before, we have been forming a concept we call agile interpretation.

Perhaps the essence of the adage "seismic interpretation is an art" suggests that there shouldn't really be a hard and fast set of rules; but having no rules begets chaos and stagnation. We think seismic interpretation is a craft. As with any craft, harnessing skill and creativity enable richer and more meaningful results. Working within a framework of principles allows one's art to flourish; paint not only with brighter, more appealing colors, but with more tailored technique for putting brush to canvas.

We have created this one-page guide as reference for seismic interpreters. Pull it out before starting, a few times in the middle, and then as a checklist or summary nearing completion of your project. We hope it's valuable for the newbie, for sorting out a plan of attack, and for seasoned veterans, to refresh work-worn concepts and tools.

We're looking to get consensus here on the things people actually do when they interpret seismic; this is very much a straw man. Maybe you have adopted some tricks that aren't obivous to the rest of us. Please leave a message in the comments section of this entry if you have any tips that would improve this handout.

Happy interpreting!

What is unconventional?

Subsurface science in the oil industry has gradually shifted in emphasis over the last five, maybe ten, years. In 2000, much of the work being done in our field was focused on conventional oil and gas plays. Today, it seems like most of what we do has something to do with unconventional resources. And this is set to continue. According to the American Petroleum Institute, unconventional gas production accounts for almost 50% of today's US Lower 48 production total of about 65 billion cubic feet per day, and is expected to reach 64% by 2020. In Canada, where unconventional gas is also very important, unconventional oil is at least as significant to geoscientists, especially bitumen. According to the Alberta govermnent, production from the Athabasca oil sands in 2011 will be about 2 million barrels per day.

But what does 'unconventional' mean? The short answer is "not conventional", which is more helpful than it sounds, and the long answer is "it depends who you ask". This is because where you draw the line between conventional and unconventional depends on what you care most about. To illustrate the point, here are some points of view...

Read More

Where on Google Earth #266

Brian nailed Where on Google Earth #265. He doesn't have a blog of his own so he asked me to host it for him. So, over to Brian...

Much thanks go to Matt here for hosting this WoGE for me since I do not yet have a blog of my own. I'm already looking into options. This is just too much fun for a Google Earth addict like me.

Although this image is zoomed in pretty good I'll invoke the Schott Rule just to give newcomers like myself a chance. For those unaware, this means you must wait one hour for each previous WoGE win before you can post your answer. [Here are the previous winners in Ron Schott's KML file — Matt].

I've also hidden the orientation compass so you can safely assume North isn't necessarily at top. Can't make it too easy now, can we?

This one isn't just about the geology, but also the historical significance.

Please post responses in the comments. Posted at 0800 Atlantic, 1200 GMT.

B is for bit depth

If you give two bits about quantitative seismic interpretation, amplitude maps, inversion, or AVO, then you need to know a bit about bits.

When seismic data is recorded, four bytes are used to store the amplitude values. A byte contains 8 bits, so four of them means 32 bits for every seismic sample, or a bit-depth of 32. As Evan explained recently, amplitude values themselves don’t mean much. But we want to use 32 bits because, at least at the field recording stage, when a day might cost hundreds of thousands of dollars, we want to capture every nuance of the seismic wavefield, including noise, multiples, reverberations, and hopefully even some signal. We have time during processing to sort it all out.

First, it’s important to understand that I am not talking about spatial or vertical resolution, what we might think of as detail. That’s a separate problem which we can understand by considering a pixelated image. It has poor resolution: it is spatially under-sampled. Here is the same image at two different resolutions. The one on the left is 300 × 240 pixels; on the right, 80 × 64 pixels (but reproduced at the same size as the other picture, so the pixels are larger). Click to read more...

Read More

Where on Google Earth #265

After correctly but illegally identifying Ole's hellish Afar Triangle in WoGE #264 over at And The Water Seems Inviting, I hereby give you number 265 in this long-running geoscience quiz game started by Clastic Detritus

Where on Google Earth is the best use of a computer and some spare time since SETI@home. If you are new to the game, it is easy to play. The winner is the first person to examine the picture below, find the location (name, link, or lat-long), and give a brief explanation of its geological interest. Please post your answer in the comments below. And thanks to the Schott Rule, which I am invoking, newbies have a slight edge: previous winners must wait one hour for each previous win before playing.

So: where and what on Google earth is this? [Posted at 1303 GMT]

Great geophysicists #2: Snellius

Willebrordus Snellius (1580–1626) was the Latin name that Dutchman Willebrord Snel van Royen, or plain Snell, used for all of his publications as a mathematician. He made great advances over his predessors by introducing trigonometric methods for measuring large distances across landcapes. He's regarded as the father of triangulation, which is widely applied in surveying, imaging, and event location. And he even tried to measure the radius of the earth.

His most famous contribution, Snell's law of refraction, has formed the basis of geometrical optics and is inherently ingrained in seismology. Snell's law is used to determine the direction of wave propagation through a refractive interface:  

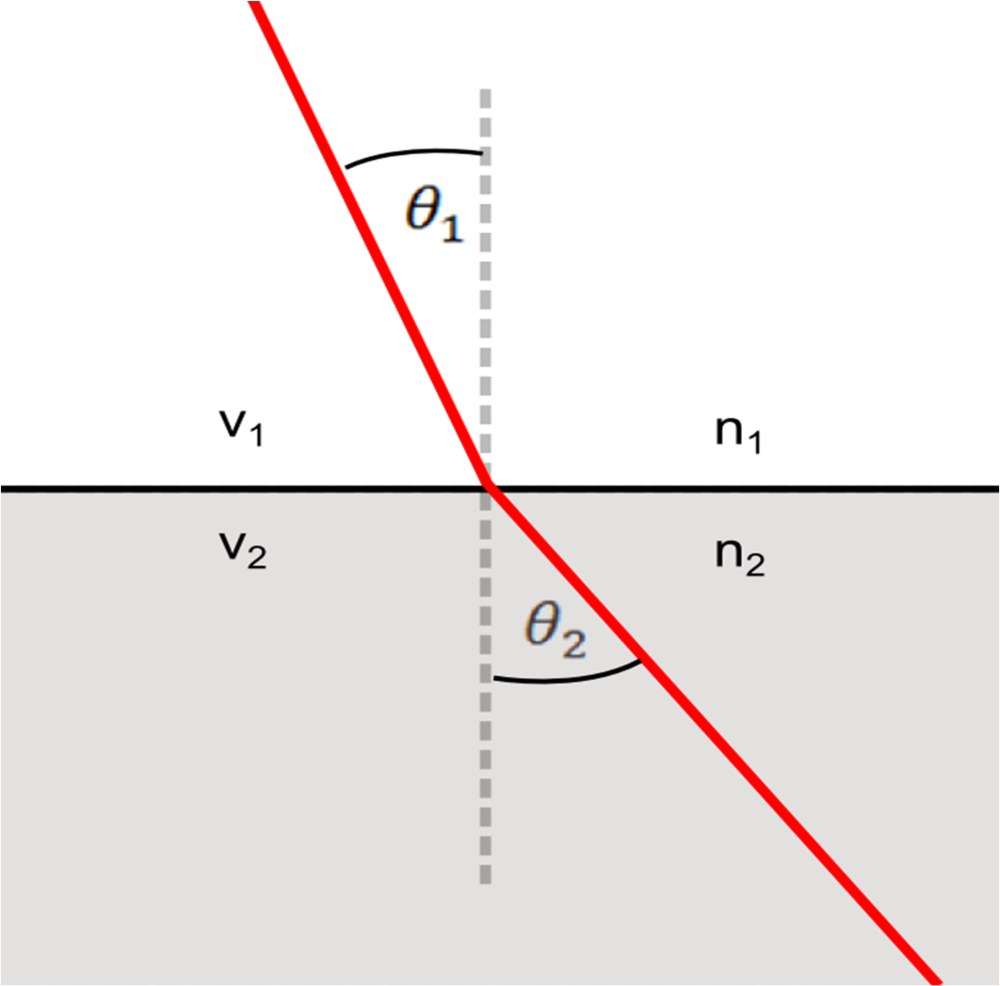
How much waves bend depends on the ratio of velocities between the two media v2/ v1. You will notice that the right hand side of this equation is where Ibn Sahl left off.

Other mathematicians before him, Ibn Sahl for instance, were aware that light rays refracted when they entered media of different velocities, but Snellius was the first to describe this problem using trigonometry. He made his discovery in 1621, when he was 41 years old, but it was never published in his lifetime. René Descartes, the inventor of the cartesian coordinate and analytical geometry, published this law of refraction 16 years after Snell's death, as Descarte's law of refraction. But Snell was eventually widely attributed with the discovery in 1703 when Christiaan Huygens published Snell's results in his Dioptrica to explain, among other things why successive wavefronts travel in parallel.

Oleg Alexandrov via Wikipedia

In a classic analogy, a 'fast' region is the beach, a ' slow' region is the water, and the fastest way for a rescuer on the beach to get to a drowning person in the water is to run, then swim, along a path that follows Snell's law. The path a ray will take upon entering a media is the one that minimzes the travel time through that media (see Fermat's principle). Notice too that there are no arrows indicating the direction of ray propagation: whether the ray enters from above or below, the refraction behaviour is the same.

In seismology, Snell's law is used to describe how seismic waves bend and turn in accordance with contrasting velocities in the subsurface which is the foundation of surveying, image focusing, and event detection. It appears in ray-tracing, ray-parameterization, offset to angle estimations (used in AVO), anisotropy problems, velocity modeling, and traveltime tomography. Snellius, we salute you!

Geophysics cheatsheet

A couple of weeks ago I posted the first cheatsheet, with some basic science tables and reminders. The idea is that you print it out, stick it in the back of your notebook, and look like a genius and/or smart alec next time you're in a meeting and someone asks, "How long was the Palaeogene?" (21 Ma) or "Is the P50 the same as the Most Likely? I can never remember," (no, it's not).

Today I present the next instalment: a geophysics cheatsheet. It contains mostly basic stuff, and is aimed at the interpreter rather than the weathered processor or number-crunching seismic analyst. I have included Shuey's linear approximation of the Zoeppritz equations; it forms the basis for many simple amplitude versus offset (AVO) analyses. But there's also the Aki–Richards equation, which is often used in more advanced pre-stack AVO analysis. There are some reminders of typical rock properties, modes of seismic multiples, and seismic polarity. 

As before, if there's anything you think I've messed up, or wrongly omitted, please leave a comment. We will be doing more of these, on topics like rock physics, core description, and log analysis. Further suggestions are welcome!

Click to download the PDF (1.6MB)

Where on Google Earth #259

I got WoGE #258 by the skin of my teeth, as I found the location but failed to fully identify the feature. I got the country rock right, but the igneous one wrong. As a soft rock chap, I consider this to be a technicality. Luckily, so did Metageologist Simon, the host. So I humbly accept my failings as a geoscientist and offer you the next instalment: number 259, and hereby post it at 1300 AST, 1700 GMT. 

Where on Google Earth is the best use of your lunch-break since Worms Reinforcements (the only computer game I ever wanted to play twice). If you are new to the game, it is easy to play. The winner is the first person to examine the picture below, find the location (name, link, or lat-long), and give a brief explanation of its geological interest. Please post your answer in the comments below. And thanks to the Schott Rule, which I am invoking, newbies have a slight edge: previous winners must wait one hour for each previous win before playing.

So: where and what on Google earth is this? (There are quite a few interesting things here, both geomorphologic and geologic; see how many you can get!)