Broken ice

Click for the latest newsUntil today, I was an SEG virgin; I can now see what all the fuss is about.

The SEG Annual Meeting is big. Massive. And it feels important, or at least significant. It is clear that exploration geophysics lives here. Every step takes you past something cool... there's FairfieldNodal's seismic node exhibit, and here's Transform Software's stained-glass-window spectral display. And every other step is like flicking through an issue of Geophysics... there's Sergey Fomel, here's Öz Yilmaz. Although I know only a few people here, I have a stong feeling of familiarity and belonging. I like it. No: I love it.

I taught my writing course this morning. It was the smallest course in the world, with a grand total of three students of the written word. Fortunately, they turned out to be wonderful company, and taught me at least twice as much as I taught them. We spent much of the morning talking about new directions in science writing, openness in industry and academia, and the competition for attention. The SEG showed considerable faith in me and my subject matter in offering this course, because it has faltered before over the years. But clearly something needs to change if we agree to offer it again... It seems that honing soft skills is not what people are looking for. Perhaps a course like mine is better suited to online consumption in bite-size webcasts. Or maybe I just needed more elliptic partial differential equations.

What do you think of courses like this? Too fluffy? Too long? Too boring?

Click here for all the posts about SEG 2011

Geophysical stamps 3: Geophone

Back in May I bought some stamps on eBay. I'm not really a stamp collector, but when I saw these in all their geophysical glory, I couldn't resist them. They are East German stamps from 1980, and they are unusual because they aren't schematic illustrations so much as precise, technical drawings. I have already written about the the gravimeter and the sonic tool stamps; today I thought I'd tell a bit about the most basic seismic sensor, the geophone.

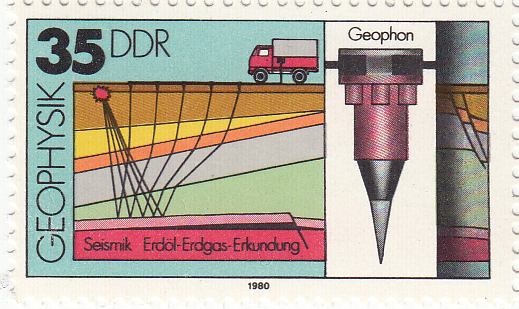
← The 35 pfennig stamp in the series of four shows a surface geophone, with a schematic cross-section and cartoon of the seismic acquisition process, complete with ray-paths and a recording truck. Erdöl and Erdgas are oil and gas, Erkundung translates as surveying or exploration. The actual size of the stamp is 43 × 26 mm.

There are four basic types of seismic sensor (sometimes generically referred to as receivers in exploration geophysics):

Seismometers — precision instruments not used in exploration seismology because they are usually quite bulky and require careful set-up and calibration. [Most modern models] are accelerometers, much like relative gravimeters, measuring ground acceleration from the force on a proof mass. Seismometers can detect frequencies in a very broad band, on the order of 0.001 Hz to 500 Hz: that's 19 octaves!

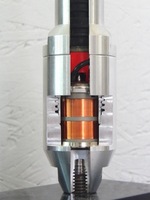
Geophones — are small, cheap, and intended for rapid deployment in large numbers. The one illustrated on the stamp, like the modern cut-away example shown here, would be about 4 × 20 cm, with a total mass of about 400 g. The design has barely changed in decades. The mean-looking spike is to try to ensure good contact with the ground (coupling). A frame-mounted magnet is surrounded by a proof mass affixed to a copper coil. This analog instrument measures particle [velocity], not acceleration, as the differential motion induces a current in the coil. Because of the small proof mass, the lower practical frequency limit is usually only about 6 Hz, the upper about 250 Hz (5 octaves). Geophones are used on land, and on the sea-floor. If repeatability over time is important, as with a time-lapse survey, phones like this may be buried in the ground and cemented in place.

Hydrophones — as the name suggests, are for deployment in the water column. Naturally, there is a lot of non-seismic motion in water, so measuring displacement will not do. Instead, hydrophones contain two piezoelectric components, which generates a current when deformed by pressure, and use cunning physics to mute spurious, non-seismic pressure changes. Hydrophones are usually towed in streamers behind a boat. They have a similar response band to geophones.

MEMS accelerometers — exactly like the accelerometer chip in your laptop or cellphone, these tiny mechanical systems can be housed in a robust casing and used to record seismic waves. Response frequencies range from 4–1000 Hz (8 octaves; theoretically they will measure down to 0 Hz, or DC in geophysish, but not in my experience). These are sometimes referred to as digital receivers, but they are really micro-analog devices with built-in digital conversion. 

I think the geophone is the single most important remote sensing device in geoscience. Is that justified hyperbole? A couple of recent stories from Scotland and Spain have highlighted the incredible clarity of seismic images, which can be awe-inspiring as well as scientifically and economically important.

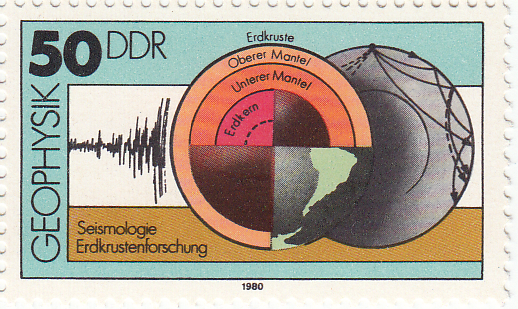
Next time I'll look at the 50 pfennig stamp, which depicts deep seismic tomography. 

Reliable predictions of unlikely geology

A puzzle

Imagine you are working in a newly-accessible and under-explored area of an otherwise mature basin. Statistics show that on average 10% of structures are filled with gas; the rest are dry. Fortunately, you have some seismic analysis technology that allows you to predict the presence of gas with 80% reliability. In other words, four out of five gas-filled structures test positive with the technique, and when it is applied to water-filled structures, it gives a negative result four times out of five.
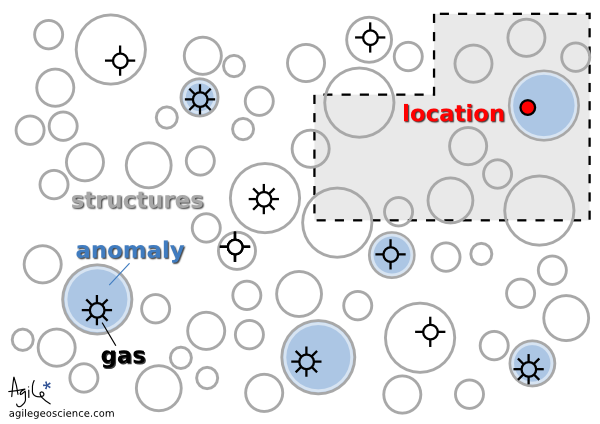
It is thought that 10% of the structures in this play are gas-filled. Your seismic attribute test is thought to be 80% reliable, because four out of five times it has indicated gas correctly. You acquire the undrilled acreage shown by the grey polygon.

You acquire some undrilled acreage—the grey polygon— then delineate some structures and perform the analysis. One of the structures tests positive. If this is the only information you have, what is the probability that it is gas-filled?

This is a classic problem of embracing Bayesian likelihood and ignoring your built-in 'representativeness heuristic' (Kahneman et al, 1982, Judgment Under Uncertainty: Heuristics and Biases, Cambridge University Press). Bayesian probability combination does not come very naturally to most people but, once understood, can at least help you see the way to approach similar problems in the future. The way the problem is framed here, it is identical to the original formulation of Kahneman et al, the Taxicab Problem. This takes place in a town with 90 yellow cabs and 10 blue ones. A taxi is involved in a hit-and-run, witnessed by a passer-by. Eye witness reliability is shown to be 80%, so if the witness says the taxi was blue, what is the probability that the cab was indeed blue? Most people go with 80%, but in fact the witness is probably wrong. To see why, let's go back to the exploration problem and look at 100 test cases.

Break it down
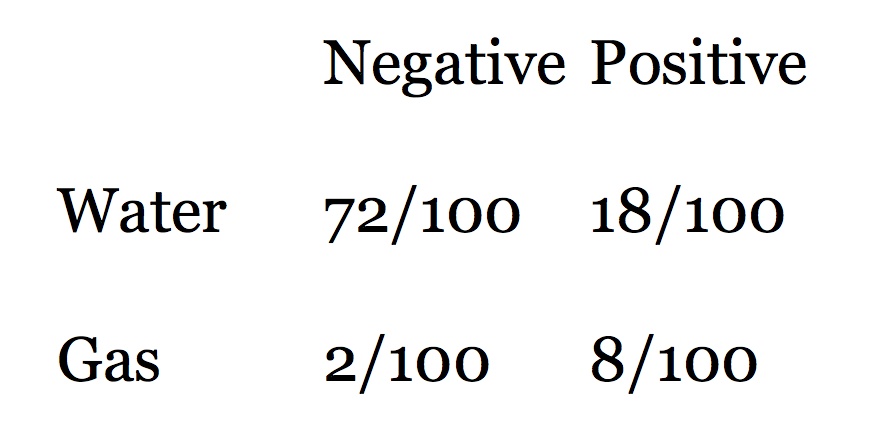
Looking at the rows in this table of outcomes, we see that there are 90 water cases and 10 gas cases. Eighty percent of the water cases test negative, and 80% of the gas cases test positive. The table shows that when we get a positive test, the probability that the test is true is not 0.80, but much less: 8/(8+18) = 0.31. In other words, a test that is mostly reliable is probably wrong when applied to an event that doesn't happen very often (a structure being gas charged). It's still good news for us, though, because a probability of discovery of 0.31 is much better than the 0.10 that we started with.

Here is Bayes' Theorem for calculating the probability P of event A (say, a gas discovery) given event B (say, a positive test in our seismic analysis):

So we can express our problem in these terms:

Are you sure about that?

This result is so counter-intuitive, for me at least, that I can't resist illustrating it with another well-known example that takes it to extremes. Imagine you test positive for a very rare disease, seismitis. The test is 99% reliable. But the disease affects only 1 person in 10 000. What is the probability that you do indeed have seismitis?

Notice that the unreliability (1%) of the test is much greater than the rate of occurrence of the disease (0.01%). This is a red flag. It's not hard to see that there will be many false positives: only 1 person in 10 000 are ill, and that person tests positive 99% of the time (almost always). The problem is that 1% of the 9 999 healthy people, 100 people, will test positive too. So for every 10 000 people tested, 101 test positive even though only 1 is ill. So the probability of being ill, given a positive test, is only about 1/101!

Lessons learned
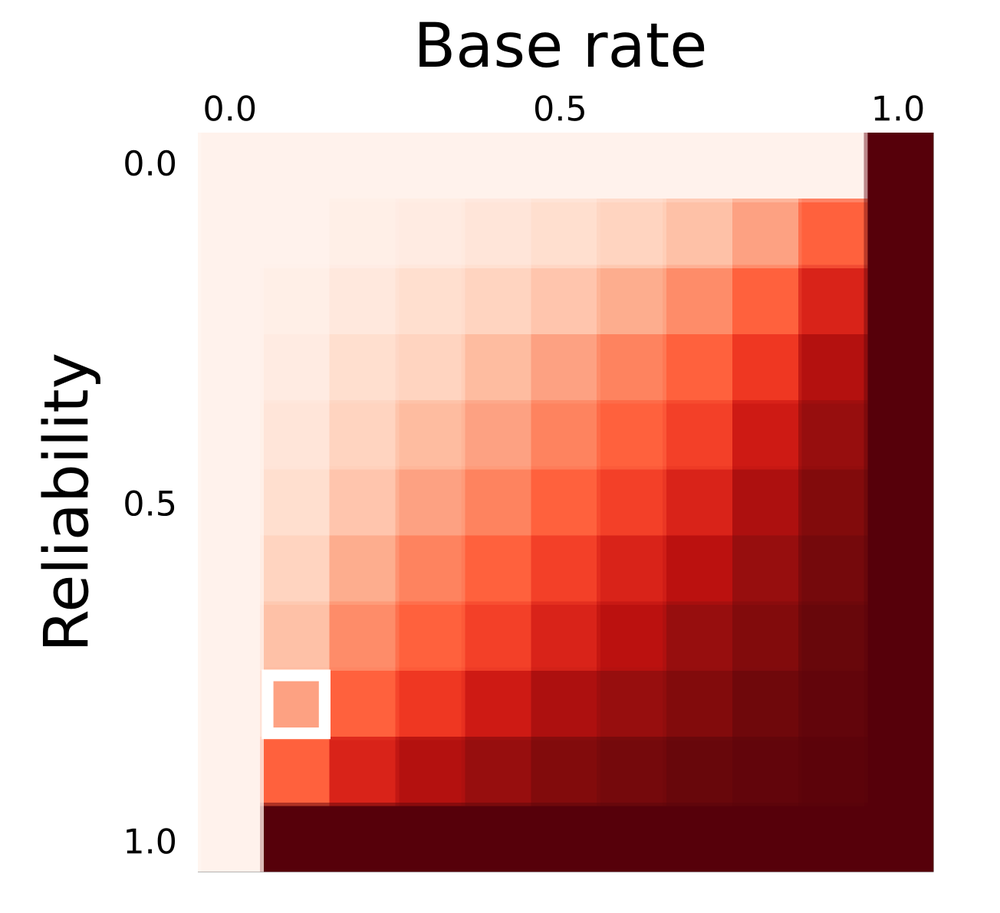
Predictive power (in Bayesian jargon, the posterior probability) as a function of test reliability and the base rate of occurrence (also called the prior probability of the event of phenomenon in question). The position of the scenario in the exploration problem is shown by the white square.

Thanks to UBC Bioinformatics for the heatmap software, heatmap.notlong.com.


Next time you confidently predict something with a seismic attribute, stop to think not only about the reliability of the test you have made, but the rate of occurrence of the thing you're trying to predict. The heatmap shows how prediction power depends on both test reliability and the occurrence rate of the event. You may be doing worse (or better!) than you think.

Fortunately, in most real cases, there is a simple mitigation: use other, independent, methods of prediction. Mutually uncorrelated seismic attributes, well data, engineering test results, if applied diligently, can improve the odds of a correct prediction. But computing the posterior probability of event A given independent observations B, C, D, E, and F, is beyond the scope of this article (not to mention this author!).

This post is a version of part of my article The rational geoscientist, The Leading Edge, May 2010

One hundred posts

Yesterday Evan posted the 100th article on the blog. Not all of them have been technical, though most are. A few were special cases, hosting the popular Where on (Google) Earth game for example. But most have been filled with geoscience goodness... at least we think so. We hope you do too.

One hundred posts isn't exactly earth-shattering, but we're proud of our work and thought we'd share some some of our greatest hits. We have our favourites, naturally. I really liked writing What is unconventional, and thought it was quite original. And I love yesterday's post, which is Evan's favourite too.

We could look at the most commented (not counting WOGEs, which always get lots of comments). The most comments were garnered by Why we should embrace openness, which got eight, and only two of those were from Evan and I. Every comment gives us warm, fuzzy feelings and it's really why we do this: a big Thank You to all our commenters, especially the serial scribes j, Richie B, Reid, Brian, and Tooney—you are awesome. Basic cheatsheet got nine comments, but four of them were from us: we do try to respond to every comment. 

It's a little harder to tell which article is the most read. There's a bias through time, since older pages have been up longer. And the front page gets most of the traffic, and each article gets a spell as the top story, but we don't track which articles are up when that page is visited. 

The most visited page is Evan's brilliant Rock physics cheatsheet; the PDF is also the most downloaded file. This is good because Evan poured his heart into building that thing. The next most popular page is The scales of geoscience, which benefitted hugely from being tagged in the social bookmarking site reddit

We love writing this blog, and plan to grow it even more over the coming months. If this is your first time, welcome! Otherwise, thank you for your support and attention. There's a lot to read on the 'net, and we're thrilled you chose this.

Geophysical stamps 2: Sonic

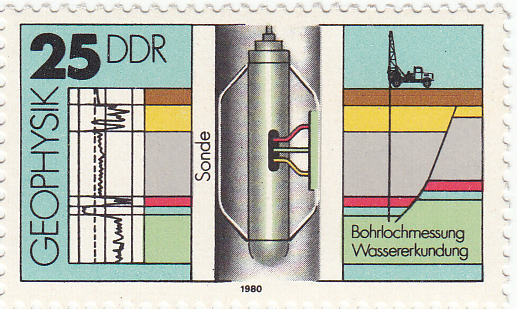
Recently I bought some stamps on eBay. This isn't something I've done before, but when I saw these stamps I couldn't resist their pure geophysical goodness. They are East German stamps from 1980, and they are unusual because they aren't fanciful illustrations, but precise, technical drawings. Last week I described the gravimeter; today it's the turn of a borehole instrument, the sonic tool.

← The 25 pfennig stamp in the series of four shows a sonic tool, complete with the logged data on the left, and a cross-section on the right. Bohrlochmessung means well-logging; Wassererkundung translates as water exploration. The actual size of the stamp is 43 × 26 mm.

The tool has two components: a transmitter and a recevier. It is lowered to the bottom of the target interval and logs data while being pulled up the hole. In its simplest form, an ultrasound pulse (typically 20–40 kHz) is emitted from the transmitter, travels through the formation, and is recorded at the receiver. The interval transit time is recorded continuously, giving the trace shown on left hand side of the stamp. Transit time is measured in µs/m (or µs/ft if you're old-school), and is generally between 160 µs/m and 550 µs/m (or, in terms of velocity, 1800 m/s to 6250 m/s). Geophysicists often use the transit time to estimate seismic velocities; it's important to correct for the phenomenon called dispersion: lower-frequency seismic waves travel more slowly than the high-frequency waves measured by these tools.

Sonic logs are used for all sorts of other things, for example:

  • Predicting the seismic response (when combined with the bulk density log)
  • Predicting porosity, because of the large difference between velocity in fluids vs minerals
  • Predicting pore pressure, an important safety concern and reservoir property
  • Measuring anisotropy, especially due to oriented fractures (important for permeability)
  • Qualitatively predicting lithology, especially coals (slow), salt (4550 m/s), dolomite (fast)

Image credit: National Energy Technology Lab.Modern tools are not all that different from early sonic tools. They measure the same thing, but with better electronics for improved vertical resolution and noise attenuation. The biggest innovations are dipole sonic tools for accurate shear-wave velocities, multi-azimuth tools for measuring anisotropy, high resolution tools, and high-pressure, high-temperature (HPHT) tools.

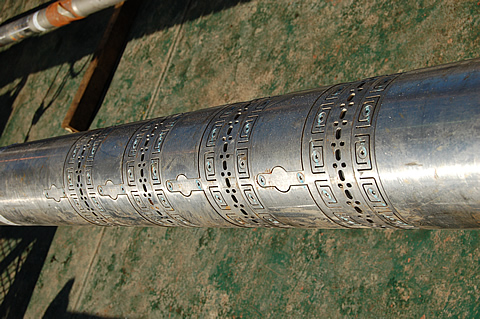
Another relatively recent advance is reliable sonic-while-drilling tools such as Schlumberger's sonicVISION™ system, the receiver array of which is shown here (for the 6¾" tool).

The sonic tool may be the most diversely useful of all the borehole logging tools. In a totally contrived scenario where I could only run a single tool, it would have to be the sonic, especially if I had seismic data... What would you choose?

Next time I'll look at the 35 pfennig stamp, which shows a surface geophone. 

Geophysical stamps

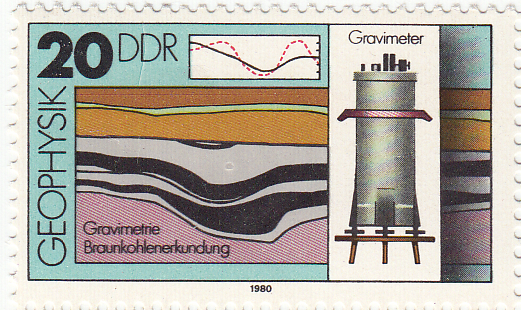
About a month ago I tweeted about some great 1980 East German stamps I'd seen on eBay. I impulsively bought them and they arrived a couple of weeks ago. I thought I'd write a bit about them and the science that inspired them. This week: Gravimeter.

East Germany in 1980 was the height of 'consumer socialism' under Chairman & General Secretary Eric Honecker. Part of this movement was a new appreciation for economic growth, and the role of science and technology in the progress of society. Putting the angsts and misdeeds of the Cold War to one side, perhaps these stamps reflect the hopes for modernity and prosperity.

← The 20 pfennig stamp from the set of four 1980 stamps from the German Democratic Republic (Deutsche Demokratische Republik). The illustration shows a relative gravimeter, the profile one might expect over a coal field (top), and a cross section through a coal deposit. Braunkohlenerkundung translates roughly as brown coal survey. Brown coal is lignite, a low-grade, low maturity coal.

There are two types of gravimeter: absolute and relative. Absolute gravimeters usually time the free-fall of a mass in a vacuum. The relative gravimeter is also a simple instrument. It must be level to measure the downward force, hence the adjustable legs. Inside the cylinder, a reference body called a proof mass is held by a spring and an electrostatic restoring force. If the gravitational force on the mass changes, the electrostatic force required to restore its position indicates the change in the gravitational field.

Fundamentally, all gravimeters measure acceleration due to gravity. Surprisingly, geophysicists do not generally use SI units, but the CGS system (centimetre–gram–second system). Thus the standard reporting units for gravimetry are not m/s2 but cm/s2, or gals (sometimes known as galileos, symbol Gal). In this system, the acceleration due to gravity at the earth's surface is approximately 980 Gal. Variations due to elevation and subsurface geology are measured in mGal or even µGal.

Image credit: David Monniaux, from commons.wikimedia.org, licensed under CC-BY-SA

Some uses for gravimeters:

  • Deep crustal structure (given the density of the crust)
  • Mineral exploration (for example, low gravity due to coal, as shown on the stamp)
  • Measuring peak ground acceleration due to natural or induced seismicity
  • Geodesic measurement, for example in defining the geoid and reference ellipsoid
  • Calibration and standards in metrology

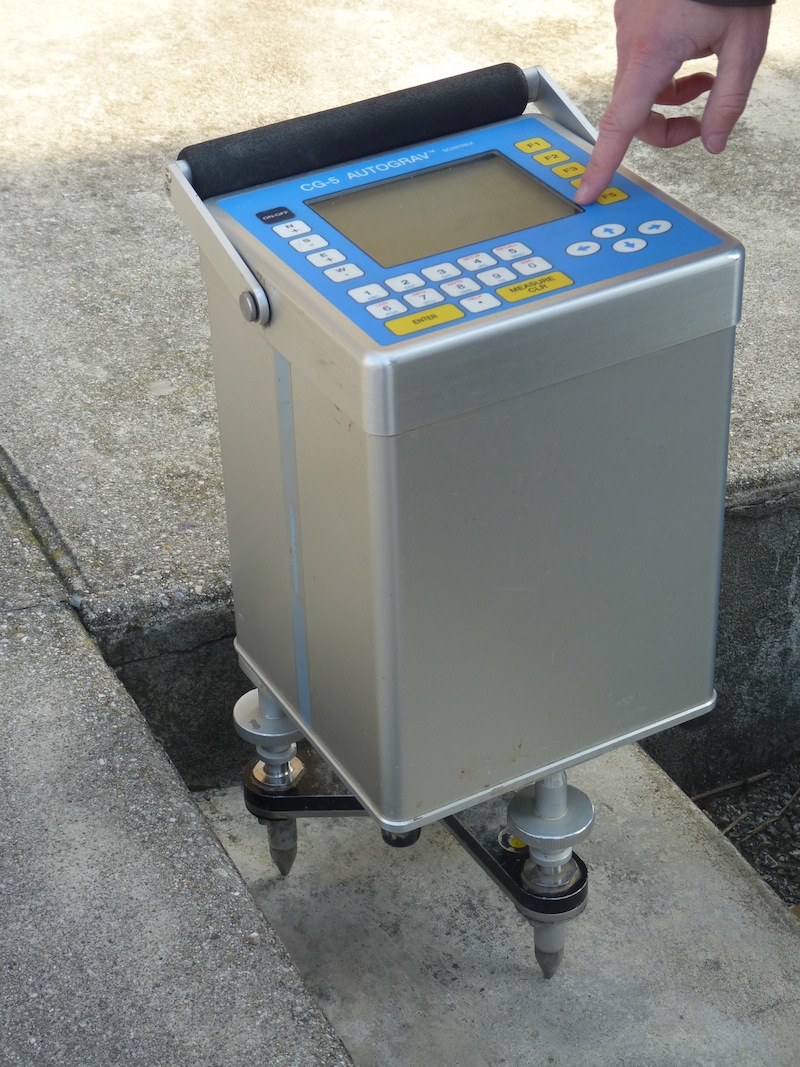
Modern relative gravimeters use the same basic engineering, but of course has much better sensitivity, smaller errors, improved robustness, remote operation, and a more user-friendly digital interface. Vibrational noise suppression is also quite advanced, with physical isolation and cunning digital signal processing algorithms. The model shown here is the Autograv CG-5 from Scintrex in Concord, Ontario, Canada. It's designed for portability and ease of use.

Have you ever wielded a gravimeter? I've never met one face to face, but I love tinkering with precision instruments. I bet they pop up on eBay occasionally...

Next time I'll look at the the 25 pfennig stamp, which depicts a sonic borehole  tool.

Best online geological maps

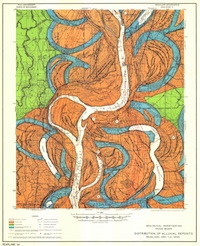
Fisk map of Mississippi RiverOne of Fisk's beautiful maps of the Mississippi River, near Readland, Arkansas. Click the map to see more detail.Like most earth scientists I know, I love maps. As a child, I pored over the AA Atlas of Britain on long car journeys. As a student, I spent hours making my first geological map. As an orienteer I learned to read maps running through rhododendron bushes in the rain. As a professional geoscientist, my greatest pleasure is still producing a fine map.

When I worked on the McMurray Formation of Alberta, my colleague came across Harold Fisk's incredible maps of the Mississippi River. These maps have to be seen to be believed, and for me they show how far computers have to go before they can be considered to have replaced paper. The effort and commitment is palpable. If I ever produce anything half as beautiful in my career, I will consider myself privileged. Even more marvellously, since they were made by the Army Corps of Engineers, they are all downloadable for free.

This resource made me wonder what other maps are out there on the web. Not surprisingly, there are lots, and some are quite special. Here's a list of my favourites:

No doubt I have missed some. If you have a favourite of your own, please add it to the comments or drop me a line and I'll be happy to post a follow-up.

The scales of geoscience

Helicopter at Mount St Helens in 2007. Image: USGS.Geoscientists' brains are necessarily helicoptery. They can quickly climb and descend, hover or fly. This ability to zoom in and out, changing scale and range, develops with experience. Thinking and talking about scales, especially those outside your usual realm of thought, are good ways to develop your aptitude and intuition. Intuition especially is bound to the realms of your experience: millimetres to kilometres, seconds to decades. 

Being helicoptery is important because processes can manifest themselves in different ways at different scales. Currents, for example, can result in sorting and rounding of grains, but you can often only see this with a hand-lens (unless the grains are automobiles). The same environment might produce ripples at the centimetre scale, dunes at the decametre scale, channels at the kilometre scale, and an entire fluvial basin at another couple of orders of magnitude beyond that. In moments of true clarity, a geologist might think across 10 or 15 orders of magnitude in one thought, perhaps even more.

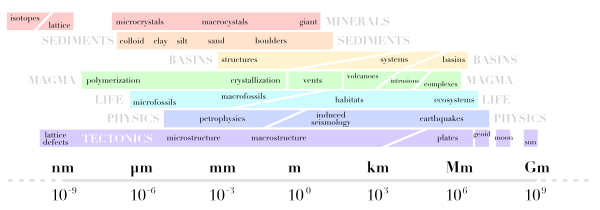
A couple of years ago, the brilliant web comic artist xkcd drew a couple of beautiful infographics depicting scale. Entitled height and depth (left), they showed the entire universe in a logarithmic scale space. More recently, a couple of amazing visualizations have offered different visions of the same theme: the wonderful Scale of the Universe, which looks at spatial scale, and the utterly magic ChronoZoom, which does a similar thing with geologic time. Wonderful.

These creations inspired me to try to map geological disciplines onto scale space. You can see how I did below. I do like the idea but I am not very keen on my execution. I think I will add a time dimension and have another go, but I thought I'd share it at this stage. I might even try drawing the next one freehand, but I ain't no Randall Munroe.

I'd be very happy to receive any feedback about improving this, or please post your own attempts!

Great geophysicists #3

Today is a historic day for greatness: Rene Descartes was born exactly 415 years ago, and Isaac Newton died 284 years ago. They both contributed to our understanding of physical phenomena and the natural world and, while not exactly geophysicists, they changed how scientists think about waves in general, and light in particular.

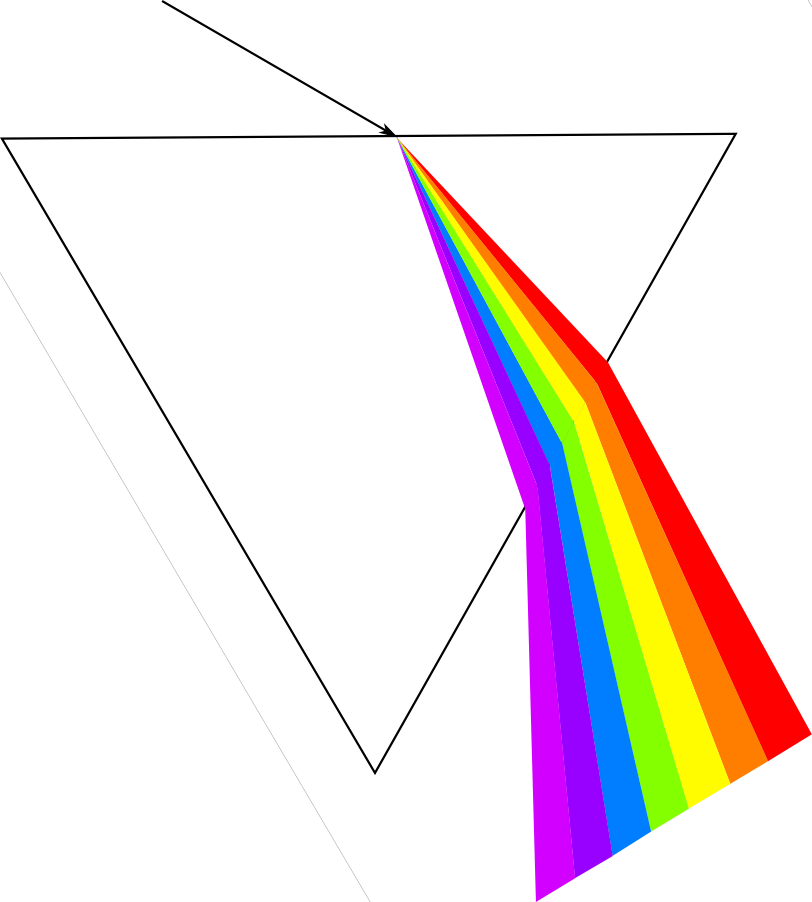
Unweaving the rainbow

Scientists of the day recognized two types of colour. Apparent colours were those seen in prisms and rainbows, where light itself was refracted into colours. Real colours, on the other hand, were a property of bodies, disclosed by light but not produced by that light. Descartes studied refraction in raindrops and helped propagate Snell’s law in his 1637 paper, Dioptrica. His work severed this apparent–real dichotomy: all colours are apparent, and the colour of an object depends on the light you shine on it.

Newton began to work seriously with crystalline prisms around 1666. He was the first to demonstrate that white light is a scrambled superposition of wavelengths; a visual cacophony of information. Not only does a ray bend in relation to the wave speed of the material it is entering (read the post on Snellius), but Newton made one more connection. The intrinsic wave speed of the material, in turn depends on the frequency of the wave. This phenomenon is known as dispersion; different frequency components are slowed by different amounts, angling onto different paths.

What does all this mean for seismic data?

Seismic pulses, which strut and fret through the earth, reflecting and transmitting through its myriad contrasts, make for a more complicated type of prism-dispersion experiment. Compared to visible light, the effects of dispersion are subtle, negligible even, in the seismic band 2–200 Hz. However, we may measure a rock to have a wave speed of 3000 m/s at 50 Hz, and 3500 m/s at 20 kHz (logging frequencies), and 4000 m/s at 10 MHz (core laboratory frequencies). On one hand, this should be incredibly disconcerting for subsurface scientists: it keeps us from bridging the integration gap empirically. It is also a reason why geophysicists get away with haphazardly stretching and squeezing travel time measurements taken at different scales to tie wells to seismic. Is dispersion the interpreters’ fudge-factor when our multi-scale data don’t corroborate?

Chris Liner, blogging at Seismos, points out

...so much of classical seismology and wave theory is nondispersive: basic theory of P and S waves, Rayleigh waves in a half-space, geometric spreading, reflection and transmission coefficients, head waves, etc. Yet when we look at real data, strong dispersion abounds. The development of spectral decomposition has served to highlight this fact.

We should think about studying dispersion more, not just as a nuisance for what is lost (as it has been traditionally viewed), but as a colourful, scale-dependant property of the earth whose stories we seek to hear.

Confounded paradox

Probabilities are notoriously slippery things to deal with, so it shouldn’t be surprising that proportions, which are really probabilities in disguise, can catch us out too.

Simpson’s paradox is my favourite example of something simple, something we know we understand, indeed have always understood, suddenly turning on us.

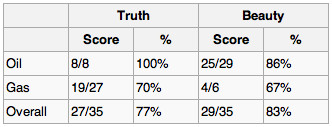
Exploration geophysicists often use information extracted from seismic data, called attributes, to help predict rock properties in the subsurface. Suppose you are a geophysicist comparing two new seismic attributes, truth and beauty, each purported to predict fluid type. You compare their hydrocarbon-predicting success rates on 35 discoveries and it’s close, but beauty has an 83% hit rate, while truth manages only 77%. There's not much in it, but since you only need one attribute, all else being equal, beauty it is.

But then someone asks you about predicting oil in particular. You dig out your data and drill down:

Apparently, truth did a little better when you just look at oil. And what about gas, they ask? Well, the data showed that truth was also better than beauty at predicting gas. So truth does a better job at both oil and gas, but somehow beauty edges out overall.

Impossible? Clearly not: these numbers are real and plausible, I haven't done anything sneaky. In this case, hydrocarbon type is a confounding variable, and it’s important to look for such groupings in your data. Improbable? No, it’s quite common in all kinds of data and this trap is well known among statisticians.

How can you avoid it? Be especially wary when the sample size in one or more of the groups you are interested in is much smaller than the others. Be even more alert if group sizes are inconsistent across the variables, as in my example: oil is under-sampled for truth, gas for beauty.

Ultimately, there's no guarantee this effect won’t crop up; that’s just how proportions are. All you can do is make sure you ask your data the questions you care about. 

This post is a version of part of my article The rational geoscientist, The Leading Edge, May 2010