I may need some help here. The truth is, while I can tell you what averages are, I can't rigorously explain when to use a particular one. I'll give it a shot, but if you disagree I am happy to be edificated.
When we compute an average we are measuring the central tendency: a single quantity to represent the dataset. The trouble is, our data can have different distributions, different dimensionality, or different type (to use a computer science term): we may be dealing with lognormal distributions, or rates, or classes. To cope with this, we have different averages.
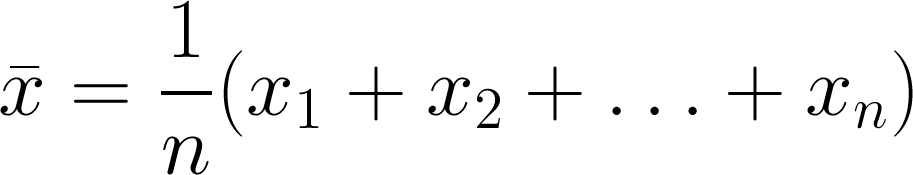 Arithmetic mean
Everyone's friend, the plain old mean. The trouble is that it is, statistically speaking, not robust. This means that it's an estimator that is unduly affected by outliers, especially large ones. What are outliers? Data points that depart from some assumption of predictability in your data, from whatever model you have of what your data 'should' look like. Notwithstanding that your model might be wrong! Lots of distributions have important outliers. In exploration, the largest realizations in a gas prospect are critical to know about, even though they're unlikely.
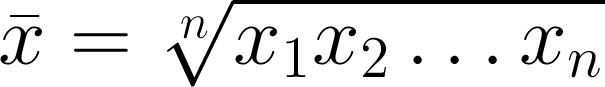 Geometric mean
Like the arithmetic mean, this is one of the classical Pythagorean means. It is always equal to or smaller than the arithmetic mean. It has a simple geometric visualization: the geometric mean of a and b is the side of a square having the same area as the rectangle with sides a and b. Clearly, it is only meaningfully defined for positive numbers. When might you use it? For quantities with exponential distributions — permeability, say. And this is the only mean to use for data that have been normalized to some reference value.
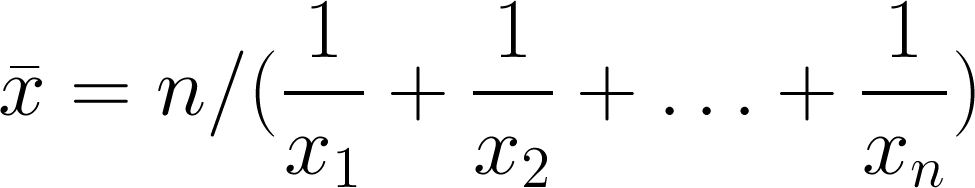 Harmonic mean
The third and final Pythagorean mean, always equal to or smaller than the geometric mean. It's sometimes (by 'sometimes' I mean 'never') called the subcontrary mean. It tends towards the smaller values in a dataset; if those small numbers are outliers, this is a bug not a feature. Use it for rates: if you drive 10 km at 60 km/hr (10 minutes), then 10 km at 120 km/hr (5 minutes), then your average speed over the 20 km is 80 km/hr, not the 90 km/hr the arithmetic mean might have led you to believe.
Median average
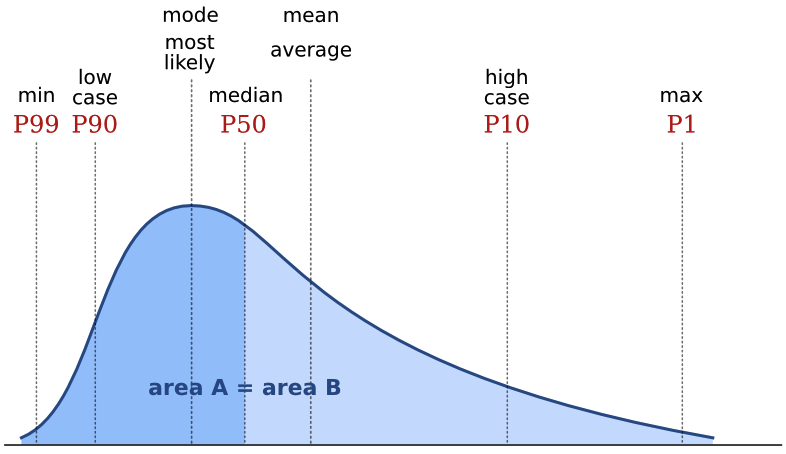
The median is the central value in the sorted data. In some ways, it's the archetypal average: the middle, with 50% of values being greater and 50% being smaller. If there is an even number of data points, then its the arithmetic mean of the middle two. In a probability distribution, the median is often called the P50. In a positively skewed distribution (the most common one in petroleum geoscience), it is larger than the mode and smaller than the mean:
Mode average
The mode, or most likely, is the most frequent result in the data. We often use it for what are called nominal data: classes or names, rather than the cardinal numbers we've been discussing up to now. For example, the name Smith is not the 'average' name in the US, as such, since most people are called something else. But you might say it's the central tendency of names. One of the commonest applications of the mode is in a simple voting system: the person with the most votes wins. If you are averaging data like facies or waveform classes, say, then the mode is the only average that makes sense.
Honourable mentions
Most geophysicists know about the root mean square, or quadratic mean, because it's a measure of magnitude independent of sign, so works on sinusoids varying around zero, for example.
Finally, the weighted mean is worth a mention. Sometimes this one seems intuitive: if you want to average two datasets, but they have different populations, for example. If you have a mean porosity of 19% from a set of 90 samples, and another mean of 11% from a set of 10 similar samples, then it's clear you can't simply take their arithmetic average — you have to weight them first: (0.9 × 0.21) + (0.1 × 0.14) = 0.20. But other times, it's not so obvious you need the weighted sum, like when you care about the perception of the data points.
Are there other averages you use? Do you see misuse and abuse of averages? Have you ever been caught out? I'm almost certain I have, but it's too late now...
There is an even longer version of this article in the wiki. I just couldn't bring myself to post it all here.
Update on 2012-08-08 12:32 by Matt Hall
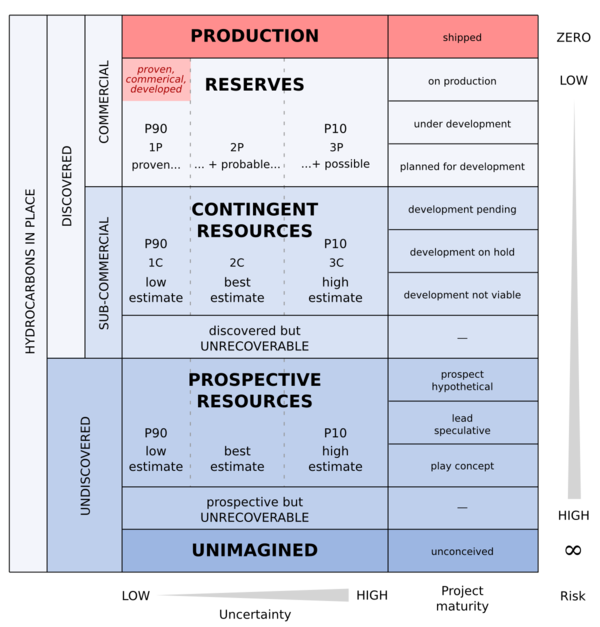
Geo-stats nut @fraserrc just reminded me that I'd missed Swanson's mean in my honourable mentions. How could I? It's a handy back-of-the-envelope estimator of the mean for a moderately skewed (usually lognormal) distribution, given P90, P50 and P10 values. It's easy, even for petroleum geologists:

It was published by retired Exxon geologist Roy Swanson, with some friends from the University of Aberdeen, and popularized by Peter Rose's courses and excellent book Risk Analysis and Management of Petroleum Exploration Ventures.
Reference
Hurst, A, G Brown, and R Swanson (2000). Swanson's 30–40–30 rule. AAPG Bulletin 84 (12), p 1883–1891. DOI 10.1306/8626C70D-173B-11D7-8645000102C1865D

 I spent Thursday and Friday at the annual Science Online unconference at North Carolina State University in Raleigh, NC. I had been looking forward to it since peeking in on—and even participating in—sessions last January at ScienceOnline2011. As soon as I had emerged from the swanky airport and navigated my way to the charmingly peculiar Velvet Cloak Inn I knew the first thing I loved was...


 Except where noted, this content is licensed