Wherefore art thou, Expert?

I don't buy the notion that we should be competent at everything we do. Unless you have chosen to specialize, as a petrophysicist or geophysical analyst perhaps, you are a generalist. Perhaps you are the manager of an asset team, or a lone geophysicist in a field development project, or a junior geologist looking after a drilling program. You are certainly being handed tasks you have never done before, and being asked to think about problems you didn't even know existed this time last year. If you're anything like me, you are bewildered at least 50% of the time.

In this post, I take a look at some problems with assuming technical professionals can be experts at everything, especially in this world of unconventional plays and methods. And I even have some ideas about what geoscientists, specialists and service companies can do about them...

Read More

Beyond the experts

I presented a poster at the 1IWRP, and it was certainly a change in tone from the technical rigor of most other talks. Since I had a good discussion at the break with a number of people, I thought I would make a video out of it. If you've got six minutes, you can check it out:

In the video I make reference to a few other topics we've touched on earlier on the blog:

I hope to be getting into making more videos soon, so let me know if you like the format, and if you have any suggestions. 

Niobrara shale field trip

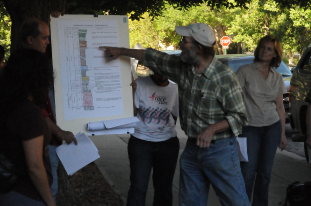
Mike Batzle explaining rock physics in the fieldOn my last day in Colorado, I went on a field trip to learn about the geology of the area. The main event was a trip to the Lyons Cemex quarry north of Boulder, where they mine the Niobrara formation to make cement. Interestingly, the same formation is being penetrated for oil and gas beneath the surface only a few thousand metres away. Apparently, the composition of the Niobrara is not desireable for construction or building materials, but it makes the ideal cement for drilling and completion operations. I find it almost poetic that the western-uplifted part of the formation is mined so that the eastern-deeper parts can be drilled; a geologic skin-graft, of sorts...
Read More

The last chat chart

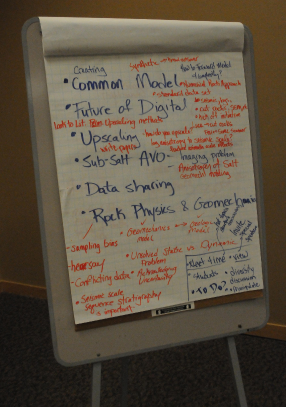
The 1IWRP technical program was closed with a one-hour brainstorming session; an attempt to capture the main issues and ideas moving forward. This was great stuff, and I was invited to jot down the bombardment of shout-outs from the crowd.   

Admittedly, no list is fully comprehensive, and this flip chart is almost laughable in its ruggedness. However, I think it represents the diversity in this crowd and the relevant issues that people will be working on in the future. The main points were:

  • Creating a common model and data sharing
  • The future of digital rock physics
  • Dealing with upscaling and scale dependant measurements
  • The use of rock physics for improving sub-salt AVO analyses
  • Strengthening the connection between rock physics and geomechanical applications

I have scribed this into a more legible form, and put some expanded commentary on AgileWiki if you want to read more about these points. 

Do you disagree with anything on this list? Have we missed something?

More 1IWRP highlights

As I reported on Wednesday, I've been at 1IWRP, a workshop on rock physics in the petroleum industry. Topics ranged from lab core studies to 3D digital scanners, and from seismic attenuation and dispersion to shales and anisotropy. Rock physics truly crosses a lot of subject areas.

Here are a few of the many great talks that really stood out for me:

Mark Chapman from the University of Edinburgh, submitted a new formulation for frequency dependant AVO analysis. He suggested that if a proper rock physics model of the rock is described, frequency can be decomposed from seismic gathers for improved reservoir characterization. Some folks in the crowd warned that the utility of this work might be limited to select cases with a full band impedance change, but his method appears to be a step beyond the traditional AVO workflow.

Arthur Cheng from Halliburton talked about modeling techniques to estimate anisotropic parameters from borehole measurements. He descibed the state of the art in acoustic logging tools, and used a ray-tracing VSP forward model to show a significant smear of reflection points through an anisotropic earth layer. He touched on the importance of close interaction between service companies and end users, especially those working in complex environments. In particular: service companies have a good understanding of data precision and accuracy, but it's usually not adequately transfered to the interpreter.

Colin Sayers from Schlumberger presented several talks, but I really enjoyed what he had to say about sonic and seismic anisotropy and how it is relevant to characterizing shale gas reservoirs. Fracture propagation depends on the 3D stress state in the rock: hard to capture with a 1D earth model. He showed an example of how hydraulic fracture behaviour could be more accurately predicted by incorporating anisotropic stress dependant elastic properties. I hope this insight permeates throughout the engineering community. 

Rob Lander from Geocosm showed some fresh-out-of-the-oven simulations of coupled diagenesis and rock physics models for predicting reservoir properties away from wells. His company's workflow has a basis in petrography, integrating cathodluminescence microscopy and diagenetic modeling. Really inspiring and integrated stuff. I submit to you that this presentation would be equally enjoyed at a meeting of AAPG, SPE, SPWLA, SEG, or SCA — that's not something that you can say about every talk. 

Every break heralded a new discussion. The delegates were very actively engaged. 

Today, I am going on a field trip to the Niobrara Shale Quarry. After four days indoors, I'm looking forward to getting outside and hammering some rocks! 

Digital rocks and accountability

There were three main sessions at the first day of the First International Workshop on Rock Physics, 1IWRP. Experimental methods, Digital rock physics, and Methods in rock physics, a softer, more philosophical session on perspectives in the lab and in the field. There have been several sessions of discussion too, occurring after every five presentations or so, which has been a refreshing addition to the program. I am looking for talks that will change the way we do things and two talks really stood out for me. 

Mark Knackstedt from Digitalcore in Australia, gave a visually stunning presentation on the state of the art in digital rock physics. You can browse Digitalcore's website and and view some of the animations that he showed. A few members of the crowd were skeptical about the nuances of characterizing microcracks and grain contacts near or below the resolution limits, as these tiny elements have a dominating role on a material's effective properties.  

In my opinion, in order to get beyond 3D visualizations, and the computational aspect of pixel counting, digital rock physicists need to integrate with petrophysicists to calibrate with logging tools. One exciting opportunity is deducing a link between laboratory and borehole-based NMR measurements for pore space and fluid characterization. 

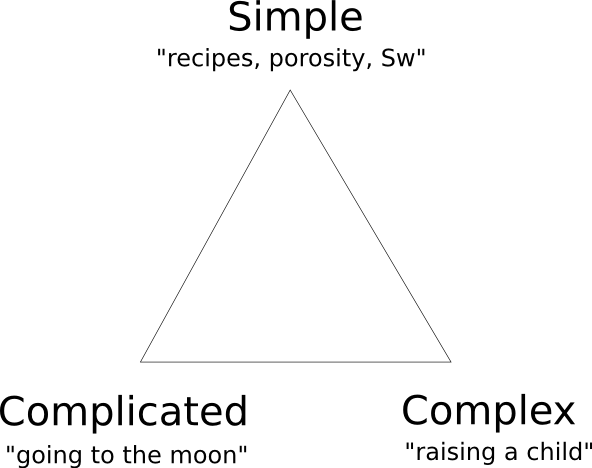
In an inspired and slightly offbeat talk, Bill Murphy 3 from e4sciences challenged the community to make the profession better by increasing accountability. Being accountable means acknowledging what you know and what you don't know. He offered Atul Gawande's surgical writings as a model for all imperfect sciences. Instead of occupying a continuum from easy to hard, rock physics problems span a ternary space from simple to complicated to complex. Simple is something that can be described by a recipe or a definite measurement, complicated is like going to the moon, and complex is like raising a child, where there's an element of unpredictability. Part of our profession should be recognizing where our problems fall in this ternary space, and that should drive how we deal with these problems.

He also explained that ours is a science full of paradoxes:

  • Taking more measurements means that we need to make more hypotheses, not fewer
  • Ubiquitous uncertainty must be met with increased precision and rigor
  • Acknowledging errors is essential for professional and scientific accountability

The next time you are working on a problem, why not estimate where it plots in this ternary space? It's likely to contain some combination of all three, and it might evolve as the project progresses. And ask your colleagues where they would place the same problem—it might surprise you. 

First-of-its-kind workshop

Next week I am going to the Colorado School of Mines to attend the First International Workshop on Rock Physics, 1IWRP. The name certainly is a bit curious: surely there must have been conferences in rock physics in the past, right? Yes, but the title points to the notion that this conference is the first time a meeting of petroleum rock physicists has happened independently of a technical society such as the EAGE or SEG. I don't see this as a specialist community revolting against these organizations, but it reflects an increase in attention and enthusiasm for the application of rock physics in the industry. Interestingly, this conference sprang directly from a discussion group on LinkedIn.

I will be presenting a poster entitled, Create a software culture beyond the experts, as part of the sesssion devoted to Transferring rock physics knowledge and technology to asset teams. It's a topic well-suited to this audience, because, even though rock physics is a key component in many areas of petroleum geoscience, it still remains partially obscure, or under-recognized as a take-it-or-leave-it niche. Mine will be a softer, community-building appeal for knowledge sharing beyond our distinguished specialists.

The technical agenda has been posted to the conference website. The conference has received solid corporate sponsorship; more than $40k according to the announcements. With 58 technical talks and 25 poster presentations over four days, plus two field trips, it is shaping up to be an intense week. A few talks that I am particularly interested in are:

  • Frequency-dependent amplitude-versus-offset analysis, Mark Chapman
  • Velocity Evolution during Controlled CaCO3 Precipitation and Dissolution, Ralf Weger, et al.
  • Anisotropic static and dynamic moduli from a pair of shale plugs cut parallel and perpendicular to bedding, Douglas Miller & Richard Plumb
  • Anisotropic permeability in fractured reservoirs from frequency-dependent seismic AVAZ data, Aamir Ali & Morten Jakobsen
  • Use of sonic and seismic anisotropy to characterize resource shales, Colin Sayers

If anything in the conference catches your eye, drop me a line in the comments and I will do my best to capture notes on it. I will be reporting highlights throughout the week on the blog, so please be sure to check back and follow along. 

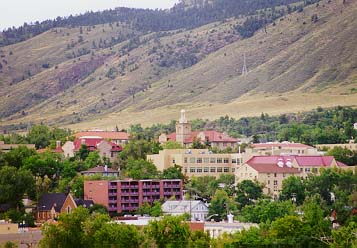
The photograph of the Colorado School of Mines campus is the work of Wikipedia user Cperko.

How to cheat at spot the difference

Yesterday I left you, dear reader, with a spot the difference puzzle. Here it is again, with my answer:

SpotTheDiff_result.png

Notice how my answer (made with GIMP) is not just a list of differences or a squiggly circle around each one. It's an exact map of the location and nature of every difference. I like the effect of seeing which 'direction' the difference goes in: blue things are in the left image but not the right. One flaw in this method is that I have reduced the image to a monochrome image; changes in colour only would not show up. 

Another way to do it, a way that would catch even a subtle colour change, is to simply difference the images. Let's look at a detail from the image—the yellow box; the difference is the centre image:

SpotDiff_More_examples.png

The right-hand image here is a further processing of the difference, using a process in ImageJ that inverts the pixels' values, making dark things bright and viceversa. This reveals a difference we would probably never have otherwise noticed: the footprint of the lossy JPEG compression kernel. Even though the two input images were compressed with 98% fidelity, we have introduced a subtle, but pervasive, artifact.

So what? Is this just an image processing gimmick? It depends how much you care about finding these differences. Not only was it easier to find all the differences this way, but now I know for certain that I have not missed any. We even see one or two very tiny differences that were surely unintentional (there's one just next to the cat's right paw). If differences (or similarities) mean a lot to you, because a medical prognosis or well location depends on their identification, the small ones might be very important!

Here's a small tutorial showing how I made the line difference, in case you are interested →

Visual crossplotting

To clarify, add detail
Edward Tufte

Pyroclastic flow on Nabro, Eritrea. Click for a larger image. NASA.Recently, the prolific geoblogger Brian Romans posted a pair of satellite images of a pyroclastic flow on Nabro in Eritrea. One image was in the visible spectrum, the other was a thermal image. Correlating them by looking back and forth at the images is unsatisying, so I spent 10 minutes merging the data into a single view, making the correlation immediate and intuitive. 

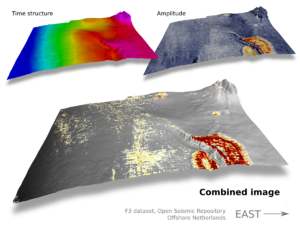
Maps like this are always better than abstractions of data like graphs or crossplots (or scatter plots, if you prefer). Plots get unwieldy with more than three dimensions, and there are almost always more dimensions to the data, especially in geoscience. In the image above there are at least half a dozen dimensions to the data: x and y position, elevation, slope, rugosity, vegetation (none!), heat intensity, heat distribution,... And these other dimensions, however tenuous or qualitative, might actually be important—they provide context, circumstantial evidence, if you will.

When I review papers, one of the comments I almost always make is: get all your data into one view—help your reader make the comparison. Instead of two maps showing slightly different seismic attributes, make one view and force the comparison. Be careful with colours: don't use them all up for one of the attributes, leaving nothing for the other. Using greys and blues for one leaves reds and yellows for the other. This approach is much more effective than a polygon around your anomaly, say, because then you have indelibly overlain your interpretation too early in the story: wait until you have unequivocally demonstrated the uncanny correlation.

If you're still not convinced that the richer image conveys more information, see how long it takes you to do this Spot The Difference. Come back tomorrow for the answer (and the point!)...

Creative Commons licensed image from Wikimedia Commons, work of User Muband (Japan)

GIMP is your friend!

Why petrophysics is hard

Earlier this week we published our fourth cheatsheet, this time for well log analysis or petrophysics. (Have you seen our other cheatsheets?) Why did we think this was a subject tricky enough to need a cheatsheet in the back of your notebook? I think there are at least three things which make the interpretation of log data difficult:

Most of the tools do not directly measure properties we are interested in. For example, the radioactivity of the rocks is not important to us, but it does make a reliable clay and organic matter proxy, because these substances tend to have more uranium and other radioactive elements in them. Almost all of the logs are just proxies for the data we really need. 

We only see the rocks through the filter of the method. Even if we could perfectly derive apparent reservoir properties from the logs, there are lots of reasons why they might be less than accurate. For example, the drilling fluid (usually some sort of brine- or oil-based suspension of mud) tends to invade the rocks, especially the more permeable formations, the very ones we are interested in. The drilling fluid can also interfere with some tools, depending on its composition: barite absorbs gamma-rays, for example. 

The field is infested with jargon and historical baggage. Since Conrad and Marcel Schlumberger invented the technique almost 100 years ago, thousands of new tools and new methods have been invented. Every tool and log has its own name, method (usually proprietary these days) and idiosyncracies, making for a bewildering, intimidating even, menagerie. Worse still, lots of modern tools collect multi-dimensional data: for example, sonic spectra on multiple axes, magnetic resonance T2 distributions, dynamically-scaled image logs. 

We drew from several sources to build our cheatsheet. We drew partly from our own experience, but also relied on input from some petrophysical specialists: Neil Watson of Atlantic Petrophysics, Andrea Creemer of Corridor Resources, and Ross Crain of Spectrum 2000. We also consulted the following references, synthesizing liberally where they disagreed (quite often, given the range of vintages of these works).

Despite referring to some of the best sources in the industry, we hereby assert that all errors are attributable to us, not our sources. If you find errors, please let us know. Get in touch on Twitter, use the contact form, or leave a comment.
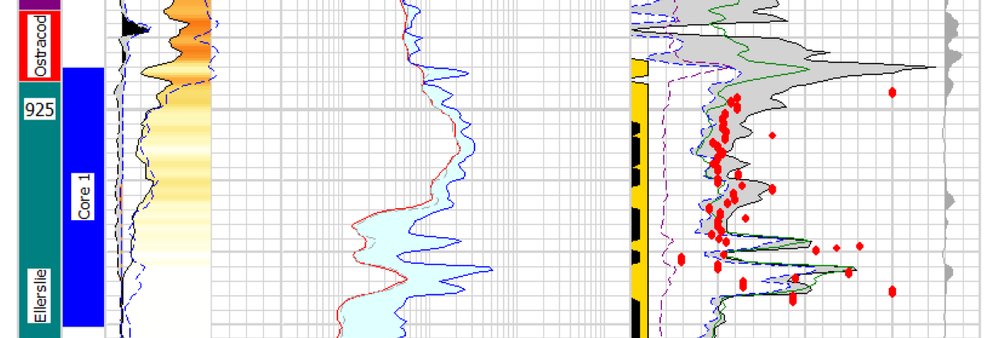
Part of Viking's Provost A4-23 in 36-6, in Alberta, Canada.