Which brittleness index?

A few weeks ago I looked at the concept — or concepts — of brittleness. There turned out to be lots of ways of looking at it. We decided to call it a rock behaviour rather than a property. And we determined to look more closely at some different ways to define it. Here they are...

Some brittleness indices

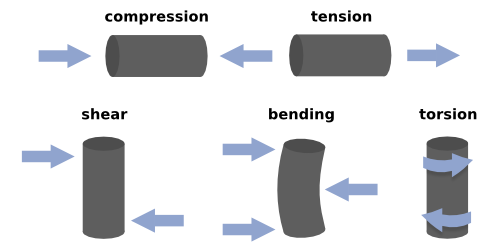
There are lots of 'definitions' of brittleness in the literature. Several of them capture the relationship between compressive and tensile strength, σC and σT respectively. This is potentially useful, because we measure uniaxial compressive strength in the standard triaxial rig tests that have become routine in shale studies... but we don't usually find the tensile strength, because it's much harder to measure. This is unfortunate, because hydraulic fracturing is initially a tensile failure (though reactivation and other failure modes do occur — see Williams-Stroud et al. 2012).

Altindag (2003) gave the following three examples of different brittleness indices. In turn, they are the strength ratio, a sort of relative strength contrast, and the mean strength (his favourite):

This is just the start, once you start digging, you'll find lots of others. Like Hucka & Das's (1974) round-up I wrote about last time, one thing they have in common is that they capture some characteristic of rock failure. That is, they do not rely on implicit rock properties.

Another point to note. Bažant & Kazemi (1990) gave a way to de-scale empirical brittleness measures to account for sample size — not surprisingly, this sort of 'real world adjustment' starts to make things quite complicated. Not so linear after all.

What not to do

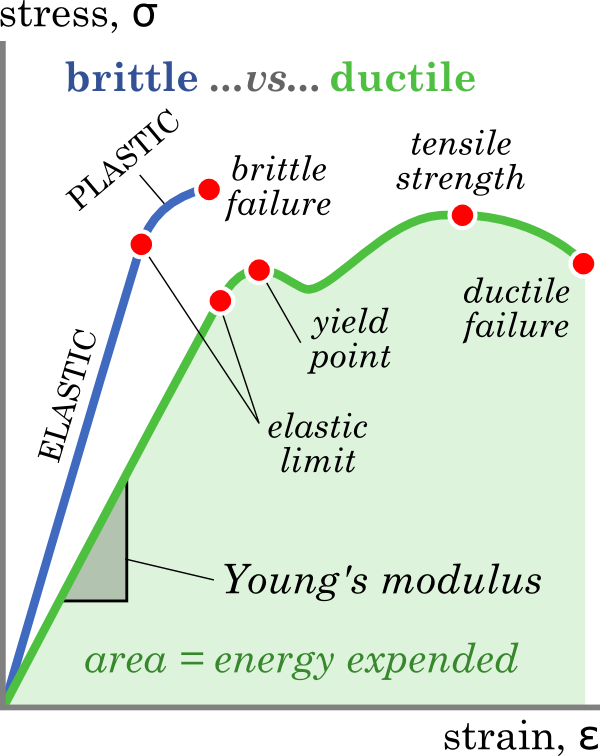
The prevailing view among many interpreters is that brittleness is proportional to Young's modulus and/or Poisson's ratio, and/or a linear combination of these. We've reported a couple of times on what Lev Vernik (Marathon) thinks of the prevailing view: we need to question our assumptions about isotropy and linear strain, and computing shale brittleness from elastic properties is not physically meaningful. For one thing, you'll note that elastic moduli don't have anything to do with rock failure.

The Young–Poisson brittleness myth started with Rickman et al. 2008, SPE 115258, who presented a rather ugly representation of a linear relationship (I gather this is how petrophysicists like to write equations). You can see the tightness of the relationship for yourself in the data.

If I understand  the notation, this is the same as writing B = 7.14E – 200ν + 72.9, where E is (static) Young's modulus and ν is (static) Poisson's ratio. It's an empirical relationship, based on the data shown, and is perhaps useful in the Barnett (or wherever the data are from, we aren't told). But, as with any kind of inversion, the onus is on you to check the quality of the calibration in your rocks. 

What's left?

Here's Altindag (2003) again:

Brittleness, defined differently from author to author, is an important mechanical property of rocks, but there is no universally accepted brittleness concept or measurement method...

This leaves us free to worry less about brittleness, whatever it is, and focus on things we really care about, like organic matter content or frackability (not unrelated). The thing is to collect good data, examine it carefully with proper tools (Spotfire, Tableau, R, Python...) and find relationships you can use, and prove, in your rocks.

References

Altindag, R (2003). Correlation of specific energy with rock brittleness concepts on rock cutting. The Journal of The South African Institute of Mining and Metallurgy. April 2003, p 163ff. Available online.

Hucka V, B Das (1974). Brittleness determination of rocks by different methods. Int J Rock Mech Min Sci Geomech Abstr 10 (11), 389–92. DOI:10.1016/0148-9062(74)91109-7.

Rickman, R, M Mullen, E Petre, B Grieser, and D Kundert (2008). A practical use of shale petrophysics for stimulation design optimization: all shale plays are not clones of the Barnett Shale. SPE 115258, DOI: 10.2118/115258-MS.

Williams-Stroud, S, W Barker, and K Smith (2012). Induced hydraulic fractures or reactivated natural fractures? Modeling the response of natural fracture networks to stimulation treatments. American Rock Mechanics Association 12–667. Available online.

Plant a seed for science and tech

Cruising around the web last weekend looking for geosciencey Christmas presents, coupled with having 3 kids (aged 9, 5, and 3) to entertain and educate, I just realized I have a long list of awesome toys to share. Well, I say toys, but these amazing things are almost in a class of their own...

Bigshot camera

A full kit for a child to build his or her own camera, and it's only $89. Probably best suited to those aged 7 up to about 12. Features:

  • comes with everything you need, including a screwdriver,
  • a crank instead of a battery,
  • multiple lenses including anaglyphic 3D,
  • a set of online tutorials about the components and how they work — enlightening!

LittleBits

Epic. For kids (and others) that aren't quite ready for a soldering iron, these magentic blocks just work. There are blocks for power, for input (like this pressure sensor), and for output. They can, and should, be combined with each other and anything else (Lego, Meccano, straws, dinosaurs) for maximum effect. Wonderful.

Anything at all from SparkFun

... and there's Adafruit too. I know we had Tandy or RadioShack or whatever in the early 1980s, but we didn't have the Internet. So life was, you know, hard. No longer. Everything at SparkFun is affordable, well-designed, well-documented, and—well—fun. I mean, who wouldn't want to build their own Simon Says

And this is just a fraction of what's out there... Lego MINDSTORMS for the bigger kids, GoldieBlox for smaller kids, Raspberry Pi for the teens. I get very excited when I think about what this means for the future of invention, creativity, and applied science. 

Even more exciting, it's us grown-ups that get to help them explore all this fun. Where will you start?

All you want for Christmas

It's that time again! If you're tired of giving the same old rocks to the same old geologists, I've got some fresh ideas for you.

Stuff

  • My wife came back from town recently with this spectacular soap, from Soap Rocks. I mean, just look at it. It's even better in real life.
  • You just can't go wrong with a beautiful hammer, like this limited edition Estwing. Don't forget safety glasses!
  • Or go miniature, with these tiny (Canadian!) hammers in gold ($859) or silver ($249). Steepish prices, but these aren't exactly mainstream.
  • More jewellery: geode earrings. Hopefully not too massive.

Tees

It's the obligatory t-shirt collection! Here are some that jumped out at me — and one of them is even a bit geophysical. Available from (left to right) Threadless (here's another fun one), Etsy, and Metropark.

Books... and non-books

  • There are loads of books in our reading list — some of them are essential, and some are totally workable as gifts.
  • It would be remiss of me not to mention our own new book, 52 Things You Should Know About Geology — perfect (I think, but I would say that) for students and professionals alike, especially those in applied/industrial geoscience.
  • I'm a big fan of Edward Tufte's beautiful books about data visualization, and they are now available in paperback. All four books for $100 is truly a bargain.
  • It's not a book exactly, but I do like this minerals poster. Although less useful, this arty version is even prettier... and this cushion is verging on spectacular. 

Goggle box

Tired of reading about geology after cranking through papers or dissertations all day? TV has rocks too! There's Iain Stewart's various series (right — Earth, 2009, and How To Grow A Planet, 2011) for some quality BBC programming. If you're in Canada, you might prefer CBC's Geologic Journey, 2011 — inexplicably hosted by a non-geologist. The Discovery Channel made Inside Planet Earth, 2009 but I've never liked their stuff. some of this stuff might even be on Netflix... 

Kids' stuff

Kids like geology too. A Rock Is Lively manages to be beautiful and informative, Rocks: Hard, Soft, Smooth, and Rough focuses on the science, and If Rocks Could Sing is just cute. If it's toys you're after, you can start them young with this wooden stacking volcano, or you could go for this epic Lego globe... (not for the half-hearted: it will require you to load the Digital Designer file and order a large number of bricks).

Still stuck? Try my Christmas post from last year, or the year before, or the year before that. I highly recommend Evelyn Mervine's posts too — loads more ideas there.

The T-shirt and book cover images are copyright of their respective owners and assumed to be fair use. The soap picture is licensed CC-BY.

52 Things is out!

The new book is out! You can now order it from Amazon.com, Amazon.co.uk, Amazon in Europe, and it will be available soon from Amazon.ca and various other online bookstores.

What's it about? I sent Andrew Miall some chapters at the proof stage; here's what he said:

Geology is all about rocks, and rocks are all about detail and field context, and about actually being out there at that critical outcrop, right THERE, that proves our point. The new book 52 Things You Should Know About Geology is full of practical tips, commentary, and advice from real geologists who have been there and know what the science is all about.

Amazing authors

A massive thank you to my 41 amazing co-authors...

Eight of these people also wrote in 52 Things You Should Know About Geophysics; the other 34 are new to this project. Between them, this crowd has over 850 years of experience in geoscience (more remarkably, just two of them account for 100 years!). Half of the authors are primarily active in North America; others are in the UK, Germany, Indonesia, India, the Netherlands, and Norway. Ten are engaged in academia, four of them as students. The diversity is wonderful as far as it goes, but the group is overwhelmingly composed of white men; it's clear we still have work to do there. 

We have the globe mostly covered in the essays themselves too. Regrettably, we have gaping holes over South America and most of Africa. We will endeavour to fix this in future books. This map shows page numbers...

Giving back

Academic publishing is a fairly marginal business, because the volumes are so small. Furthermore, we are committed to offering books at consumer, not academic, prices. The 42 authors have shown remarkable generosity of time and spirit in drafting these essays for the community at large. If you enjoy their work, I'm certain they'd love to hear about it.

In part to recognize their efforts, and to give something back to the community that supports these projects (that's you!), we approached the AAPG Foundation and offered to donate $2 from every sale to the charity. They were thrilled about this — and we look forward to helping them bring geoscience to more young people.

These books are all about sharing — sharing knowledge and sharing stories. These are the things that make our profession the dynamic, sociable science that it is. If you would like to order 10 or more copies for your friends, students, or employees, do get in touch and we will save you some money.

Great geophysicists #10: Joseph Fourier

Joseph Fourier, the great mathematician, was born on 21 March 1768 in Auxerre, France, and died in Paris on 16 May 1830, aged 62. He's the reason I didn't get to study geophysics as an undergraduate: Fourier analysis was the first thing that I ever struggled with in mathematics.

Fourier was one of 12 children of a tailor, and had lost both parents by the age of 9. After studying under Lagrange at the École Normale Supérieure, Fourier taught at the École Polytechnique. At the age of 30, he was an invited scientist on Napoleon's Egyptian campaign, along with 55,000 other men, mostly soldiers:

Citizen, the executive directory having in the present circumstances a particular need of your talents and of your zeal has just disposed of you for the sake of public service. You should prepare yourself and be ready to depart at the first order.
Herivel, J (1975). Joseph Fourier: The Man and the Physicist, Oxford Univ. Press.

He stayed in Egypt for two years, helping found the modern era of Egyptology. He must have liked the weather because his next major work, and the one that made him famous, was Théorie analytique de la chaleur (1822), on the physics of heat. The topic was incidental though, because it was really his analytical methods that changed the world. His approach of decomposing arbitrary functions into trignometric series was novel and profoundly useful, and not just for solving the heat equation

Fourier as a geophysicist

Late last year, Evan wrote about the reason Fourier's work is so important in geophysical signal processing in Hooray for Fourier! He showed how we can decompose time-based signals like seismic traces into their frequency components. And I touched the topic in K is for Wavenumber (decomposing space) and The spectrum of the spectrum (decomposing frequency itself, which is even weirder than it sounds). But this GIF (below) is almost all you need to see both the simplicity and the utility of the Fourier transform. 

In this example, we start with something approaching a square wave (red), and let's assume it's in the time domain. This wave can be approximated by summing the series of sine waves shown in blue. The amplitudes of the sine waves required are the Fourier 'coefficients'. Notice that we needed lots of time samples to represent this signal smoothly, but require only 6 Fourier coefficients to carry the same information. Mathematicians call this a 'sparse' representation. Sparsity is a handy property because we can do clever things with sparse signals. For example, we can compress them (the basis of the JPEG scheme), or interpolate them (as in CGG's REVIVE processing). Hooray for Fourier indeed.

The watercolour caricature of Fourier is by Julien-Leopold Boilly from his work Album de 73 Portraits-Charge Aquarelle’s des Membres de I’Institute (1820); it is in the public domain.

Read more about Fourier on his Wikipedia page — and listen to this excellent mini-biography by Marcus de Sautoy. And check out Mostafa Naghizadeh's chapter in 52 Things You Should Know About Geophysics. Download the chapter for free!

52 Things... About Geology

Welcome to the new book from Agile Libre! The newest, friendliest, awesomest book about petroleum geoscience. 

The book will be out later in November, pending review of the proof, but you can pre-order it now from Amazon.com at their crazy offer price of only $13.54. When it comes out, the book will hit Amazon.ca, Amazon.co.uk, and other online booksellers.

63 weeks to mature

It's truly a privilege to publish these essays. When an author hands over a manuscript, they are trusting the publisher and editors to do justice not just to the words, but to the thoughts inside. And since it's impossible to pay dozens of authors, they did it all for nothing. To recognize their contributions to the community, we're donating $2 from every book sale to the AAPG Foundation. Perhaps the students that benefit from the Foundation will go on to share what they know. 

This book took a little stamina, compared to 52 Things... Geophysics. We started inviting authors on 1 July 2012, and it took 442 days to get all the essays. As before, the first one came almost immediately; this time it was from George Pemberton, maintaining the tradition of amazing people being great champions for these projects. Indeed, Tony Doré — another star contributor — was a big reason the book got finished.

What's inside?

To whet your appetite, here are the first few chapters from the table of contents:

  • Advice for a prospective geologist — Mark Myers, 14th Director of the USGS
  • As easy as 1D, 2D, 3D — Nicholas Holgate, Aruna Mannie, and Chris Jackson
  • Computational geology — Mark Dahl, exploration geologist at ConocoPhillips
  • Coping with uncertainty — Duncan Irving at TeraData
  • Geochemical alchemy — Richard Hardman, exploration legend
  • Geological inversion — Evan Bianco of Agile
  • Get a helicopter not a hammer — Alex Cullum of Statoil

Even this short list samples some of the breadth of topics, and the range of experience of the contributors. Nichlas and Aruna are PhD students of Chris Jackson at Imperial College London, and Richard Hardman is a legend on the UK exploration scene, with over 50 years of experience. Between them, the 42 authors have notched up over 850 career-years — the book is a small window into this epic span of geological thinking.

We're checking the proofs right now. The book should be out in about 2 weeks, just in time for St Barbara's day!

Pre-order now from Amazon.com 
Save more than 25% off the cover price!

It's $13.54 today, but Amazon sets the final price... I don't know how long the offer will last. 

October linkfest

From Hart (2013). ©SEG/AAPGIt's the Hallowe'en linkfest! Just the good bits from our radar...

If you're a member of SEG or AAPG, you can't have missed their new joint-venture journal, Interpretation. Issue 2 just came out. My favourite article so far has been Bruce Hart's Whither seismic stratigraphy in Issue 1. It included these excellent little forward models from an earlier paper of his — it's so important for interpreter's to think in this space where geological architecture and geophysical imaging overlap. 

Muon tomography is in the news again, this time in relation to monitoring CCS repositories (last time it was volcanos). Jon Gluyas, author of the textbook Petroleum Geoscience, is the investgator at Durham in the UK (my alma mater). I do love the concept — imaging the subsurface with cosmic rays — but I'm only just getting to grips with sound waves.

If you read this blog regularly, you probably have some geeky tendencies. We've linked to a couple of these blogs before, but they're must-read for anyone into technology and geoscience, with lots of code and workflow examples: 

Continuing the geeky theme, we've been getting more and more into building things recently. Check out our fiddling in GitHub (a code repository) — an easy way in is code.agilegeoscience.com. Watch this space!

Speaking of fiddling with code, you already know about the hackathon we hosted in Houston last month. But there's talk of repeating the fun at the AAPG Annual Convention, also in Houston, in April next year. Brian Romans has started a list of potential projects around digital stratigraphy — please leave a comment there or here to add to it. Where's the gap in your workflow?

A few more quick hits:

If you want these nuggets fresh, you can follow me on Twitter or glance at my pinboard. If you have stuff to share, use the comments or get in touch. Over and out.

Seismic models: Hart, BS (2013). Whither seismic stratigraphy? Interpretation, volume 1 (1), and is copyright of SEG and AAPG. The image from the Trowel Blazers event is licensed CC-BY-SA by Wikipedia user Mrjohncummings

What is brittleness?

Brittleness is an important rock characteristic, but impossible to define formally because there are so many different ways of looking at it. For this reason, Tiryaki (2006) suggests we call it a rock behaviour, not a rock property.

Indeed, we're not really interested in brittleness, per se, because it's not very practical information on its own. Mining engineers are concerned with a property called cuttability — and we can think of this as conceptually analogous to the property that interests lots of geologsts, geophysicists, and engineers in petroleum, geothermal, and hydrology: frackability. In materials science, the inverse property — the ability of a rock to resist fracture — is called fracture toughness. 

What is brittleness not?

  • It's not the same as frackability, or other things you might be interested in.
  • It's not a simple rock property like, say, density or velocity. Those properties are condition-dependent too, but we agree on how to measure them.
  • It's not proportional to any elastic moduli, or a linear combination of Young's modulus and Poisson's ratio, despite what you might have heard.

So what is it then?

It depends a bit what you care about. How the rock deforms under stress? How much energy it takes to break it? What happens when it breaks? Hucka and Das (1974) rounded up lots of ways of looking at it. Here are a few:

  • Brittle rocks undergo little to no permanent deformation before failure and, depending on the test conditions, may occur suddenly and catastrophically.
  • Brittle rocks undergo little or no ductile deformation past the yield point (or elastic limit) of the rock. Note that some materials, including many rocks, have no well-defined yield point because they have non-linear elasticity.
  • Brittle rocks absorb relatively little energy before fracturing. The energy absorbed is equal to the area under the stress-strain curve (see figure).
  • Brittle rocks have a strong tendency to fracture under stress.
  • Brittle rocks break with a high ratio of fine to coarse fragments.

All of this is only made more complicated by the fact that there are lots of kinds of stress: compression, tension, shear, torsion, bending, and impact... and all of these can operate in multiple dimensions, and on multiple time scales. Suddenly a uniaxial rig doesn't quite seem like enough kit.

It will take a few posts to really get at brittleness and frackability. In future posts we'll look at relevant rock properties and how to measure them, the difference between static and dynamic measurements, and the multitude of brittleness indices. Eventually, we'll get on to what all this means for seismic waves, and ask whether frackability is something we can reasonably estimate from seismic data.

Meanwhile, if you have observations or questions to share, hit us in the comments. 

References and further reading
Hucka V, B Das (1974). Brittleness determination of rocks by different methods. Int J Rock Mech Min Sci Geomech Abstr 10 (11), 389–92. DOI:10.1016/0148-9062(74)91109-7

Tiryaki (2006). Evaluation of the indirect measures of rock brittleness and fracture toughness in rock cutting. The Journal of The South African Institute of Mining and Metallurgy 106, June 2006. Available online.

P is for Phase

Seismic is about acoustic vibration. The archetypal oscillation, the sine wave, describes the displacement y of a point around a circle. You only need three pieces of information to describe it perfectly: the size of the circle, the speed at which it rotates around the circle, and where it starts from expressed as an angle. These quantities are better known as the amplitude, frequency, and phase respectively. These figures show how varying each of them affects the waveform:

So phase describes the starting point as an angle, but notice that this manifests itself as an apparent lateral shift in the waveform. For seismic data, this means a time shift. More on this later. 

What about seismic?

We know seismic signals are not so simple — they are not repetitive oscillations — so why do the words amplitudefrequency and phase show up so often? Aren't these words horribly inadequate?

Not exactly. Fourier's methods allow us to construct (and deconstruct) more complicated signals by adding up a series of sine waves, as long as we get the amplitude, frequency and phase values right for each one of them. The tricky part, and where much of where the confusion lies, is that even though you can place your finger on any point along a seismic trace and read off a value for amplitude, you can't do that for frequency or phase. The information for those are only unlocked through spectroscopy.

Phase shifts or time shifts?

The Ricker wavelet is popular because it can easily be written analytically, and it is comprised of a considerable number of sinusoids of varying amplitudes and frequencies. We might refer to a '20 Hz Ricker wavelet' but really it contains a range of frequencies. The blue curve shows the wavelet with phase = 0°, the purple curve shows the wavelet with a phase shift of π/3 = 60° (across all frequencies). Notice how the frequency content remains unchanged.

So for a seismic reflection event (below), phase takes on a new meaning. It expresses a time offset between the reflection and the maximum value on the waveform. When the amplitude maximum is centered at the reflecting point, it is equally shaped on either side — we call this zero phase. Notice how variations in the phase of the event alter the relative position of the peak and sidelobes. The maximum amplitude of the event at 90° is only about 80% of the amplitude at zero phase. This is why I like to plot traces along with their envelope (the grey lines). The envelope contains all possible phase rotations. Any event whose maximum value does not align with the maximum on the envelope is not zero phase.

Understanding the role of phase in time series analysis is crucial for both data processors aiming to create reliable data, and interpreters who operate under the assertion that subtle variations in waveform shape can be attributed to underlying geology. Waveform classification is a powerful attribute... but how reliable is it?

In a future post, I will cover the concept of instantaneous phase on maps and sections, and some other practical interpretation tips. If you have any of your own, share them in the comments.

Additional reading
Liner, C (2002). Phase, phase, phase. The Leading Edge 21, p 456–7. Abstract online.

Do something that scares you

Last week, I asked if we — our community of practice — is comfortable with the murky zone between corporate marketing and our technical societies. Lots of discussion ensued. On reflection, I was a little unclear about exactly whom I was picking on — corporate marketers (mostly) or technical societies. Today, I thought I'd dig deeper into the corporate marketing side a little, and think about what the future might look like. We can look at societies some other time. 

What marketing used to be

Marketing used to mean nothing less prosaic than buying and selling stuff. Since the post-war consumer revolution, it has gradually expanded in scope and today covers advertising, promotion, publicity, branding, and customer management.

Unfortunately, much of what comes out of marketing departments is spin. How else could it be? The marketers only have control over their own domain, they don't design or build or even use the products. They're 'only doing their job' — positioning their products in the market, obsessing about the competition, negotiating ad space, and tweaking their brand image. Beyond the simple transmission of information — a necessary service to the world — all this effort is aimed at making their products and services look better than they actually are. 

Recognizing brokenness

Some totally real readers of this blog. Let's start with some easy things: if your marketing people can't answer questions about your products and services, they don't care enough — replace them. If they write copy that contains the words 'innovative', 'breakthrough', or 'unleash' — replace them. If you ask them for 'something new' and get back stock photos with pictures of your software pasted over them — replace them.

The problem with all this — buying more ad space, building bigger booths, getting better seats at hockey games, and so on — is... well, there are lots:

  • We've seen it all before, it's boring. Is that your message?
  • Thanks to the Matthew effect, the biggest wallet will win. Is that you?
  • It's all about you, the brand, not them, your users and customers.
  • I don't trust you. You are biased. I trust my friends and colleagues. 

Walk the walk

Like losing weight, getting fit, or writing a novel, I'm afraid there's no easy way: you have to do the hard work. Stop looking for new ways to tell everyone you're the most awesome company with the most powerful software. Just be the most awesome company. Show don't tell. Build great software and services and, more importantly, do great things with them. Competitors can copy what you do, especially if they are Petrel (they will beat you every time), but not how you do it. Instead of trying to play tennis against Roger Federer, you might do better changing the game to The Settlers of Catan, or super-solar space spag (no, that game has not been invented yet). 

Here are some ideas for your next expo. These things should scare you. If not, find something that does.

  • Bring developers to talk to people and connect them with your users.
  • Show people your development process, your bug list, and your roadmap. 
  • Hold a clinic and help your users help each other do more awesome things.
  • Brainstorm new product ideas right there on the show floor. Have a developer prototype the best one each day.
  • Broadcast your ideas in front of your competitors. They will weep with fear because they know they lack your courage and audacity. They can copy algorithms, but they can't copy awesomeness
  • Watch people using your products. Let them teach you how they want to work.
  • Hold a contest to find The Power User. Can your best user beat your best consultant?
  • An iPad draw? Seriously? You just want my email address to spam me. I have an iPad.
  • Hide your sales and marketing people for a day and see what happens.

Above all, stop copying your competitors. They suck at marketing too. 

Advice for the rest of us

I know not everyone feels as strongly as I do, and some people seem happy with the status quo. But to everyone else, I have a challenge: Demand to be delighted.

Next time you are confronted with some sales and marketing cruft, dare to ask hard questions. Have high expectations. Refuse the stuffed toy — "What has this got to do with my work?". Laugh at the lame pen, don't stuff it in your pocket. Call out the sexist nonsense. And when you find a booth that's working hard to please the people that really matter, reward them with your attention.

If you're a marketer, what would you do if there was no risk of failure? If you're a victim of marketing, what would could should a service company do to delight you?