Well data woes

I probably shouldn't be telling you this, but we've built a little tool for wrangling well data. I wanted to mention it, becase it's doing some really useful things for us — and maybe it can help you too. But I probably shouldn't because it's far from stable and we're messing with it every day.

But hey, what software doesn't have a few or several or loads of bugs?

Buggy data?

It's not just software that's buggy. Data is as buggy as heck, and subsurface data is, I assert, the buggiest data of all. Give units or datums or coordinate reference systems or filenames or standards or basically anything at all a chance to get corrupted in cryptic ways, and they take it. Twice if possible.

By way of example, we got a package of 10 wells recently. It came from a "data management" company. There are issues... Here are some of them:

  • All of the latitude and longitude data were in the wrong header fields. No coordinate reference system in sight anywhere. This is normal of course, and the only real side-effect is that YOU HAVE NO IDEA WHERE THE WELL IS.
  • Header chaos aside, the files were non-standard LAS sort-of-2.0 format, because tops had been added in their own little completely illegal section. But the LAS specification has a section for stuff like this (it's called OTHER in LAS 2.0).
  • Half the porosity curves had units of v/v, and half %. No big deal...
  • ...but a different half of the porosity curves were actually v/v. Nice.
  • One of the porosity curves couldn't make its mind up and changed scale halfway down. I am not making this up.
  • Several of the curves were repeated with other names, e.g. GR and GAM, DT and AC. Always good to have a spare, if only you knew if or how they were different. Our tool curvenam.es tries to help with this, but it's far from perfect.
  • One well's RHOB curve was actually the PEF curve. I can't even...

The remarkable thing is not really that I have this headache. It's that I expected it. But this time, I was out of paracetamol.

Cards on the table

Our tool welly, which I stress is very much still in development, tries to simplify the process of wrangling data like this. It has a project object for collecting a lot of wells into a single data structure, so we can get a nice overview of everything: 

Click to enlarge.

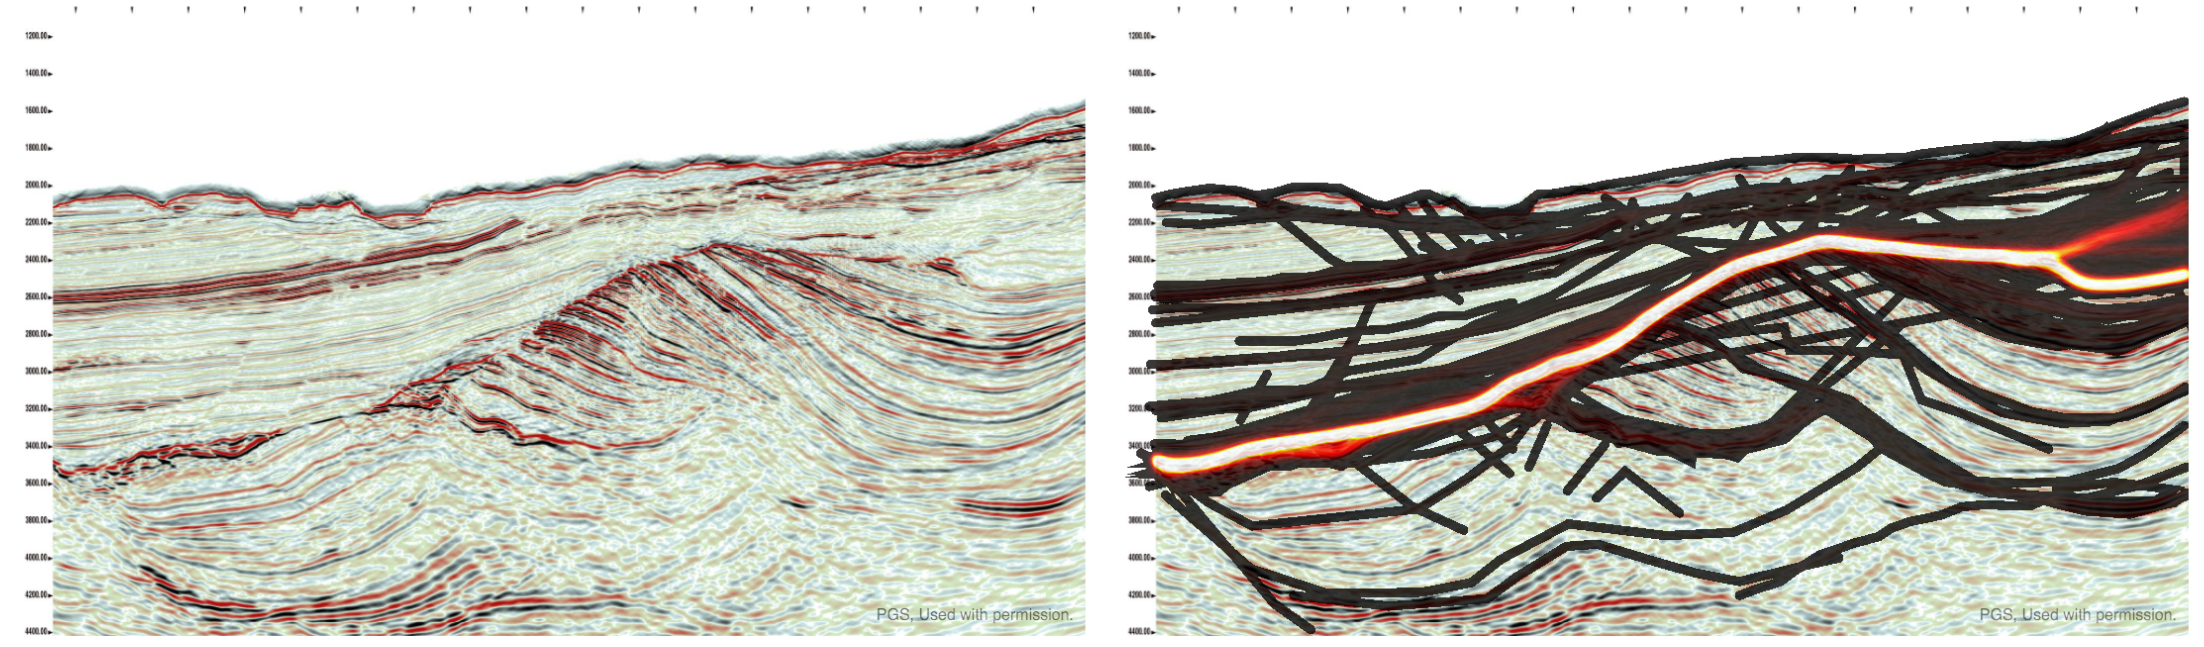
Our goal is to include these curves in the training data for a machine learning task to predict lithology from well logs. The trained model can make really good lithology predictions... if we start with non-terrible data. Next time I'll tell you more about how welly has been helping us get from this chaos to non-terrible data.

x lines of Python: read and write SEG-Y

Reading SEG-Y files comes up a lot in the geophysicist's workflow. Writing, less often, but it does come up occasionally. As long as we're mostly concerned with trace data and not location, both of these tasks can be fairly easily accomplished with ObsPy. 

Today we'll load some seismic, compute an attribute on it, and save a new SEG-Y, in 10 lines of Python.


ObsPy is a rare thing. It demonstrates what a research group can accomplish with a little planning and a lot of perseverance (cf my whinging earlier this year about certain consortiums in our field). It's an open source Python package from the geophysicists at the University of Munich — Karl Bernhard Zoeppritz studied there for a while, so you know it's legit. The tool serves their research in earthquake and global seismology needs, and also happens to handle SEG-Y files quite nicely.

Aside: I think SixtyNorth's segpy is actually the way to go for reading and writing SEG-Y; ObsPy is probably overkill for most applications — it's about 80 times the size for one thing. I just happen to be familiar with it and it's super easy to install: conda install obspy. So, since minimalism is kind of the point here, look out for a future x lines of Python using that library.

The sentences

As before, we'd like to express the process in just a few sentences of plain English. Assuming we just want to read the data into a NumPy array, look at it, do something to it, and write a new file, here's what we're doing:

  1. Read (or really index) the file as an ObsPy Stream object.
  2. Stack (in the NumPy sense) the Trace objects into a single NumPy array. We have data!
  3. Get the 99th percentile of the amplitudes to make plotting easier.
  4. Plot the data so we can see it.
  5. Get the sample interval of the data from a trace header.
  6. Compute the similarity attribute using our library bruges.
  7. Make a new Stream object to hold the outbound data.
  8. Add a Stats object, which holds the header, and recycle some header info.
  9. Append info about our data to the header.
  10. Write a new SEG-Y file with our computed data in it!

There's a bit more in the Jupyter Notebook (examining the file and trace headers, for example, and a few more plots) which, remember, you can run right in your browser! You don't need to install a thing. Please give it a look! Quick tip: Just keep hitting Shift+Enter to run the cells.

If you like this sort of thing, and are planning to be at the SEG Annual Meeting in Dallas next month, you might like to know that we'll be teaching our Creative Geocomputing class there. It's basically two days of this sort of thing, only with friends to learn with and us to help. Come and learn some new skills!

The seismic data used in this post is from the NPRA seismic repository of the USGS. The data is in the public domain.

x lines of Python: synthetic wedge model

Welcome to a new blog series! Like the A to Z and the Great Geophysicists, I expect it will be sporadic and unpredictable, but I know you enjoys life's little nonlinearities as much as I.

The idea with this one — x lines of Python — is to share small geoscience workflows in x lines or fewer. I'm not sure about the value of x, but I think 10 seems reasonable for most tasks. If x > 10 then the task may have been too big... If x < 5 then it was probably too small.

Python developer Raymond Hettinger says that each line of code should be equivalent to a sentence... so let's say that that's the measure of what's OK to put in a single line. 

Synthetic wedge model

To kick things off, follow this link to a live Jupyter Notebook environment showing how you can make a simple synthetic three-rock wedge model in only 9 lines of code.

The sentences represented by the code that made the data in these images are:

  1. Set up the size of the model.
  2. Make the slanty bit, with 1's in the wedge and 2's in the base.
  3. Add the top of the model as 0; these numbers will turn into rocks.
  4. Define the velocity and density of rocks 0 to 2.
  5. Distribute those properties through the model.
  6. Calculate the acoustic impedance everywhere.
  7. Calculate the reflection coefficients in the model.
  8. Make a Ricker wavelet.
  9. Convolve the wavelet with the reflection coefficients.

Your turn!

All of the notebooks we share in this series will be hosted on mybinder.org. I'm excited about this because it means you can run and edit them live, without installing anything at all. Give it a go right now.

You can see them on GitHub too, and fork or clone them from there. Note that if you look at the notebook for this post on GitHub, you'll be able to view it, but not change or run code unless you get everything running on your own machine. (To do that, you can more or less follow the instructions in my User Guide to the TLE tutorials).

Please do take this notion of x as 'par' as a challenge. If you'd like to try to shoot under par, please do — and share your efforts. Code golf is a fun way to learn better coding habits. (And maybe some bad ones.) There is a good chance I will shoot some bogies on this course.

We will certainly take requests too — what tasks would you like to see in x lines of Python?

PRESS START

The dust has settled from the Subsurface Hackathon 2016 in Vienna, which coincided with EAGE's 78th Conference and Exhibition (some highlights). This post builds on last week's quick summary with more detailed descriptions of the teams and what they worked on. If you want to contact any of the teams, you should be able to track them down via the links to Twitter and/or GitHub.

A word before I launch into the projects. None of the participants had built a game before. Many were relatively new to programming — completely new in one or two cases. Most of the teams were made up of people who had never worked together on a project before; indeed, several team mates had never met before. So get ready to be impressed, maybe even amazed, at what members of our professional community can do in 2 days with only mild provocation and a few snacks.

Traptris

An 8-bit-style video game, complete with music, combining Tetris with basin modeling.

Team: Chris Hamer, Emma Blott, Natt Turner (all MSc students at the University of Leeds), Jesper Dramsch (PhD student, Technical University of Denmark, Copenhagen). GitHub repo.

Tech: Python, with PyGame.

Details: The game is just like Tetris, except that the blocks have lithologies: source, reservoir, and seal. As you complete a row, it disappears, as usual. But in this game, the row reappears on a geological cross-section beside the main game. By completing further rows with just-right combinations of lithologies, you build an earth model. When it's deep enough, and if you've placed sources rocks in the model, the kitchen starts to produce hydrocarbons. These migrate if they can, and are eventually trapped — if you've managed to build a trap, that is. The team impressed the judges with their solid gamplay and boisterous team spirit. Just installing PyGame and building some working code was an impressive feat for the least experienced team of the hackathon.

Prize: We rewarded this rambunctious team for their creative idea, which it's hard to imagine any other set of human beings coming up with. They won Samsung Gear VR headsets, so I'm looking forward to the AR version of the game.

Flappy Trace

A ridiculously addictive seismic interpretation game. "So seismic, much geology".

Team: Håvard Bjerke (Roxar, Oslo), Dario Bendeck (MSc student, Leeds), and Lukas Mosser (PhD student, Imperial College London).

Tech: Python, with PyGame. GitHub repo.

Details: You start with a trace on the left of the screen. More traces arrive, slowly at first, from the right. The controls move the approaching trace up and down, and the pick point is set as it moves across the current trace and off the screen. Gradually, an interpretation is built up. It's like trying to fly along a seismic horizon, one trace at a time. The catch is that the better you get, the faster it goes. All the while, encouragements and admonishments flash up, with images of the doge meme. Just watching someone else play is weirdly mesmerizing.

Prize: The judges wanted to recognize this team for creating such a dynamic, addictive game with real personality. They won DIY Gamer kits and an awesome book on programming Minecraft with Python.

Guess What!

Human seismic inversion. The player must guess the geology that produces a given trace.

Team: Henrique Bueno dos Santos, Carlos Andre (both UNICAMP, Sao Paolo), and Steve Purves (Euclidity, Spain)

Tech: Python web application, on Flask. It even used Agile's nascent geo-plotting library, g3.js, which I am pretty excited about. GitHub repo. You can even play the game online!

Details: This project was on a list of ideas we crowdsourced from the Software Underground Slack, and I really hoped someone would give it a try. The team consisted of a postdoc, a PhD student, and a professional developer, so it's no surprise that they managed a nice implementation. The player is presented with a synthetic seismic trace and must place reflection coefficients that will, she hopes, forward model to match the trace. She may see how she's progressing only a limited number of times before submitting her final answer, which receives a score. There are so many ways to control the game play here, I think there's a lot of scope for this one.

Prize: This team impressed everyone with the far-reaching implications of the game — and the rich possibilities for the future. They were rewarded with SparkFun Digital Sandboxes and a copy of The Thrilling Adventures of Lovelace and Babbage.

DiamondChaser

aka DiamonChaser (sic). A time- and budget-constrained drilling simulator aimed at younger players.

Team: Paul Gabriel, Björn Wieczoreck, Daniel Buse, Georg Semmler, and Jan Gietzel (all at GiGa infosystems, Freiberg)

Tech: TypeScript, which compiles to JS. BitBucket repo. You can play the game online too!

Details: This tight-knit group of colleagues — all professional developers, but using unfamiliar technology — produced an incredibly polished app for the demo. The player is presented with a blank cross section, and some money. After choosing what kind of drill bit to start with, the drilling begins and the subsurface is gradually revealed. The game is then a race against the clock and the ever-diminishing funds, as diamonds and other bonuses are picked up along the way. The team used geological models from various German geological surveys for the subsurface, adding a bit of realism.

Prize: Everyone was impressed with the careful design and polish of the app this team created, and the quiet industry they brought to the event. They each won a CellAssist OBD2 device and a copy of Charles Petzold's Code.

Some of the participants waiting for the judges to finish their deliberations. Standing, from left: Håvard Bjerke, Henrique Bueno dos Santos, Steve Purves. Seated: Jesper Dramsch, Lukas Mosser, Natt Turner, Emma Blott, Dario Bendeck, Carlos André, B…

Some of the participants waiting for the judges to finish their deliberations. Standing, from left: Håvard Bjerke, Henrique Bueno dos Santos, Steve Purves. Seated: Jesper Dramsch, Lukas Mosser, Natt Turner, Emma Blott, Dario Bendeck, Carlos André, Björn Wieczoreck, Paul Gabriel.

Credits and acknowledgments

Thank you to all the hackers for stepping into the unknown and coming along to the event. I think it was everyone's first hackathon. It was an honour to meet everyone. Special thanks to Jesper Dramsch for all the help on the organizational side, and to Dragan Brankovic for taking care of the photography.

The Impact HUB Vienna was a terrific venue, providing us with multiple event spaces and plenty of room to spread out. HUB hosts Steliana and Laschandre were a great help. Der Mann produced the breakfasts. Il Mare pizzeria provided lunch on Saturday, and Maschu Maschu on Sunday.

Thank you to Kristofer Tingdahl, CEO of dGB Earth Sciences and a highly technical, as well as thoughtful, geoscientist. He graciously agreed to act as a judge for the demos, and I think he was most impressed with the quality of the teams' projects.

Last but far from least, a huge Thank You to the sponsor of the event, EMC, the cloud computing firm that was acquired by Dell late last year. David Holmes, the company's CTO (Energy) was also a judge, making an amazing opportunity for the hackers to show off their skills, and sense of humour, to a progressive company with big plans for our industry.

Open source geoscience is _________________

As I wrote yesterday, I was at the Open Source Geoscience workshop at EAGE Vienna 2016 on Monday. Happily, the organizers made time for discussion. However, what passes for discussion in the traditional conference setting is, as I've written before, stilted.

What follows is not an objective account of the proceedings. It's more of a poorly organized collection of soundbites and opinions with no real conclusion... so it's a bit like the actual discussion itself.

TL;DR The main take home of the discussion was that our community does not really know what to do with open source software. We find it difficult to see how we can give stuff away and still make loads of money. 

I'm not giving away my stuff

Paraphrasing a Schlumberger scientist:

Schlumberger sponsors a lot of consortiums, but the consortiums that will deliver closed source software are our favourites.

I suppose this is a way to grab competitive advantage, but of course there are always the other consortium members so it's hardly an exclusive. A cynic might see this position as a sort of reverse advantage — soak up the brightest academics you can find for 3 years, and make sure their work never sees the light of day. If you patent it, you can even make sure no-one else gets to use the ideas for 20 years. You don't even have to use the work! I really hope this is not what is going on.

I loved the quote Sergey Fomel shared; paraphrasing Matthias Schwab, his former advisor at Stanford: 

Never build things you can't take with you.

My feeling is that if a consortium only churns out closed source code, then it's not too far from being a consulting shop. Apart from the cheap labour, cheap resources, and no corporation tax.

Yesterday, in the talks in the main stream, I asked most of the presenters how people in the audience could go and reproduce, or simply use, their work. The only thing that was available was a commerical OpendTect plugin of dGB's, and one free-as-in-beer MATLAB utility. Everything else was unavailble for any kind of inspection, and in one case the individual would not even reveal the technology framework they were using.

Support and maintenance

Paraphrasing a Saudi Aramco scientist:

There are too many bugs in open source, and no support. 

The first point is, I think, a fallacy. It's like saying that Wikipedia contains inaccuracies. I'd suggest that open source code has about the same number of bugs as proprietary software. Software has bugs. Some people think open source is less buggy; as Linus Torvalds said: "Given enough eyeballs, all bugs are shallow." Kristofer Tingdahl (dGB) pointed out that the perceived lack of support is a business opportunity for open source community. Another participant mentioned the importance of having really good documentation. That costs money of course, which means finding ways for industry to support open source software development.

The same person also said something like:

[Open source software] changes too quickly, with new versions all the time.

...which says a lot about the state of application management in many corporations and, again, may represent opportunity rather than a threat to open source movement.

Only in this industry (OK, maybe a couple of others) will you hear the impassioned cry, "Less change!" 

The fog of torpor

When a community is falling over itself to invent new ways to do things, create new value for people, and find new ways to get paid, few question the sharing and re-use of information. And by 'information' I mean code and data, not a few PowerPoint slides. Certainly not all information, but lots. I don't know which is the cause and which is the effect, but the correlation is there.

In a community where invention is slow, on the other hand, people are forced to be more circumspect, and what follows is a cynical suspicion of the motives of others. Here's my impression of the dynamic in the room during the discussion on Monday, and of course I'm generalizing horribly:

  • Operators won't say what they think in front of their competitors
  • Vendors won't say what they think in front of their customers and competitors
  • Academics won't say what they think in front of their consortium customers sponsors
  • Students won't say what they think in front of their advisors and potential employers

This all makes discussion a bit stilted. But it's not impossible to have group discussions in spite of these problems. I think we achieved a real, honest conversation in the two Unsessions we're done in Calgary, and I think the model we used would work perfectly in all manner of non-technical and in technical settings. We just have to start doing it. Why our convention organizers feel unable to try new things at conferences is beyond me.

I can't resist finishing on something a person at Chevron said at the workshop:

I'm from Chevron. I was going to say something earlier, but I thought maybe I shouldn't.

This just sums our industry up.

Open source FWI, I mean geoscience

I'm being a little cheeky. Yesterday's Open Source Geoscience workshop at EAGE was not really only about full waveform inversion (FWI). True, it was mostly about geophysics, but there was quite a bit of new stuff too.

But there was quite a bit on FWI.

The session echoed previous EAGE sessions on the same subject in 2006 and 2012, and was chaired by Filippo Broggini (of ETH Zürich), Sergey Fomel (University of Texas), Thomas Günther (LIAG Hannover), and Russell Hewett (Total, unfortunately not present). It started with a look at core projects like Madagascar and OpendTect. There were some (for me) pretty hard core, mathematics-heavy contributions. And we got a tour of some new and newish projects that are seeking users and/or contributors. Rather than attempting to cover everything, I'm going to exercise my (biased and ill-gotten) judgment and focus on some highlights from the day.

Filippo Broggini started by reminding us of why Joe Dellinger (BP) started this recurrent workshop a decade ago. Here's how Joe framed the value of open source to our community:

The economic benefits of a collaborative open-source exploration and production processing and research software environment would be enormous. Skilled geophysicists could spend more of their time doing innovative geophysics instead of mediocre computer science. Technical advances could be quickly shared and reproduced instead of laboriously re-invented and reverse-engineered. Oil companies, contractors, academics, and individuals would all benefit.

Did I mention that he wrote that 10 years ago?

Lessons learned from the core projects

Kristofer Tingdahl (dGB) then gave the view from his role as CEO of dGB Earth Sciences, the company behind OpendTect, the free and open source geoscience interpretation tool. He did a great job of balancing the good (their thousands of users, and their SEG Distinguished Achievement Award 2016) with the less good (the difficulty of building a developer community, and the struggle to get beyond only hundreds of paying users). His great optimism and natural business instinct filled us all with hope.

The irrepressible Sergey Fomel summed up 10 years of Madagascar's rise. In the journey from v0.9 to v2.0, the projects has moved from SourceForge to GitHub, gone from 6 to 72 developers, jumped from 30 to 260 reproducible papers, and been downloaded over 40 000 times. He also shared the story of his graduate experience at Stanford, where he was involved in building the first 'reproducible science' system with Jon Claerbout in the early 1990s. Un/fortunately, it turned out to be unreproducible, so he had to build Madagascar.

It's not (yet?) a core project, but John Stockwell (Colorado School of Mines) talked about OpenSeaSeis and barely mentioned SeismicUnix. This excellent little seismic processing project is now owned by CSM, after its creator, Bjoern Olofsson, had to give it up when he went to work for a corporation (makes sense, right? o_O ). The tool includes SeaView, a standalone SEGY viewer, as well as a graphical processing flow composer called XSeaSeis. IT prides itself on its uber-simple architecture (below). Want a gain step? Write gain.so and you're done. Perfect for beginners.

Jeffrey Shragge (UWA), Bob Clapp (SEP), and Bill Symes (Rice) provided some perspective from groups solving big math problems with big computers. Jeff talked about coaxing Madgascar — or M8R as the cool kids apparently refer to it — into the cloud, where it can chomp through 100 million core hours without setting tings on fire. This is a way for small enterprises and small (underfunded) research teams to get big things done. Bob told us about a nifty-looking HTML5 viewer for subsurface data... which I can't find anywhere. And Bill talked about 'mathematical fidelty'. and its application to solving large, expensive problems without creating a lot of intermediate data. His message: the mathematics should provide the API.

New open source tools in geoscience

The standout of the afternoon for me was University of Vienna post-doc Eun Young Lee's talk about BasinVis. The only MATLAB code we saw — so not truly open source, though it might be adapted to GNU Octave — and the only strictly geological package of the day. To support her research, Eun Young has built a MATLAB application for basin analysis, complete with a GUI and some nice visuals. This one shows a geological surface, gridded in the tool, with a thickness map projected onto the 'floor' of the scene:

I'm poorly equipped to write much about the other projects we heard about. For the record and to save you a click, here's the list [with notes] from my 'look ahead' post:

  • SES3D [presented by Alexey Gokhberg], a package from ETHZ for seismic modeling and inversion.
  • OpenFOAM [Gérald Debenest], a new open source toolbox for fluid mechanics.
  • PyGIMLi [Carsten Rücker], a geophysical modeling and inversion package.
  • PySIT [Laurent Demanet], the Python seismic imaging toolbox that Russell Hewett started while at MIT.
  • Seismic.jl [Nasser Kazemi] and jInv [Eldad Haber], two [modeling and inversion] Julia packages.

My perception is that there is a substantial amount of overlap between all of these packages except OpenFOAM. If you're into FWI you're spoilt for choice. Several of these projects are at the heart of industry consortiums, so it's a way for corporations to sponsor open source projects, which is awesome. However, most of them said they have closed-source components which only the consortium members get access to, so clearly the messaging around open source — the point being to accelerate innovation, reduce bugs, and increase value for everyone — is missing somewhere. There's still this idea that secrecy begets advantage begets profit, but this idea is wrong. Hopefully the other stuff, which may or may not be awesome, gets out eventually.


I gave a talk at the end of the day, about ways I think we can get better at this 'openness' thing, whatever it is. I will write about that some time soon, but in the meantime you're welcome to see my slides here.

Finally, a little time — two half-hour slots — was set aside for discussion. I'll have a go at summing that up in another post. Stay tuned!

BasinVis image © 2016 Eun Young Lee, used with permission. OpenSeaSeis image © 2016 Center for Wave Phenomena

READY PLAYER 1

The Subsurface Hackathon 2016 is over! Seventeen hackers gathered for the weekend at Impact HUB Vienna — an awesome venue and coworking space — and built geoscience-based games. I think it was the first geoscience hackathon in Europe, and I know it was the first time a bunch of geoscientists have tried to build games for each other in a weekend.

What went on 

The format of the event was the same as previous events: gather on Saturday, imagine up some projects, start building them by about 11 am, and work on them until Sunday at 4. Then some demos and a celebration of how amazingly well things worked out. All interspersed with coffee, food, and some socializing. And a few involuntary whoops of success.

What we made

The projects were all wonderful, but in different ways. Here's a quick look at what people built:

  • Trap-tris — a group of lively students from the University of Leeds and the Technical University of Denmark built a version of Tetris that creates a dynamic basin model. 
  • Flappy Seismic — another University of Leeds student, one from Imperial College, and a developer from Roxar, built a Flappy Bird inspired seismic interpretation game.
  • DiamonChaser (sic) — a team of devs from Giga Infosystems in Freiberg built a very cool drilling simulation game (from a real geomodel) aimed at young people.
  • Guess What — a developer from Spain and two students from UNICAMP in Brazil built a 'guess the reflection coefficient' game for inverting seismic.

I will write up the projects properly in a week or two (this time I promise :) so you can see some screenshots and links to repos and so on... but for now here are some more pictures of the event.

The fun this year was generously sponsored by EMC. David Holmes, the company's CTO (Energy), spent his weekend hanging out at the venue, graciously mentoring the teams and helping to provide some perspective or context, and help carrying pizza boxes through the streets of Vienna, when it was needed.


Click on the hackathon tag below to read about previous hackathons

ORCL vs GOOG: the $9 billion API

What's this? Two posts about the legal intricacies of copyright in the space of a fortnight? Before you unsubscribe from this definitely-not-a-law-blog, please read on because the case of Oracle America, Inc vs Google, Inc is no ordinary copyright fight. For a start, the damages sought by Oracle in this case [edit: could] exceed $9 billion. And if they win, all hell is going to break loose.

The case is interesting for some other reasons besides the money and the hell breaking loose thing. I'm mostly interested in it because it's about open source software. Specifically, it's about Android, Google's open source mobile operating system. The claim is that the developers of Android copied 37 application programming interfaces, or APIs, from the Java software environment that Sun released in 1995 and Oracle acquired in its $7.4 billion acquisition of Sun in 2010. There were also claims that they copied specific code, not just the interface the code presents to the user, but it's the API bit that's interesting.

What's an API then?

You might think of software in terms of applications like the browser you're reading this in, or the seismic interpretation package you use. But this is just one, very high-level, type of software. Other, much lower-level software runs your microwave. Developers use software to build software; these middle levels contain FORTRAN libraries for tasks like signal processing, tools for making windows and menus appear, and still others for drawing, or checking spelling, or drawing shapes. You can think of an API like a user interface for programmers. Where the user interface in a desktop application might have menus and dialog boxes, the interface for a library has classes and methods — pieces of code that hold data or perform tasks. A good API can be a pleasure to use. A bad API can make grown programmers cry. Or at least make them write a new library.

The Android developers didn't think the Java API was bad. In fact, they loved it. They tried to license it from Sun in 2007 and, when Sun was bought by Oracle, from Oracle. When this didn't work out, they locked themselves in a 'cleanroom' and wrote a runtime environment called Dalvik. It implemented the same API as the Java Virtual Machine, but with new code. The question is: does Oracle own the interface — the method names and syntaxes? Are APIs copyrightable?

I thought this case ended years ago?

It did. Google already won the argument once, on 31 May 2012, when the court held that APIs are "a system or method of operations" and therefore not copyrightable. Here's the conclusion of that ruling:

The original 2012 holding that Google did not violate the copyright Act by copying 37 of Java's interfaces. Click for the full PDF.

The original 2012 holding that Google did not violate the copyright Act by copying 37 of Java's interfaces. Click for the full PDF.

But it went to the Federal Circuit Court of Appeals, Google's petition for 'fair use' was denied, and the decision was sent back to the district court for a jury trial to decide on Google's defence. So now the decision will be made by 10 ordinary citizens... none of whom know anything about programming. (There was a computer scientist in the pool, but Oracle sent him home. It's okay --- Google sent a free-software hater packing.)

This snippet from one of my favourite podcasts, Leo Laporte's Triangulation, is worth watching. Leo is interviewing James Gosling, the creator of Java, who was involved in some of the early legal discovery process...

Why do we care about this?

The problem with all this is that, when it come to open source software and the Internet, APIs make the world go round. As the Electronic Frontier Foundation argued on behalf of 77 computer scientists (including Alan Kay, Vint Cerf, Hal Abelson, Ray Kurzweil, Guido van Rossum, and Peter Norvig, ) in its amicus brief for the Supreme Court... we need uncopyrightable interfaces to get computers to cooperate. This is what drove the personal computer explosion of the 1980s, the Internet explosion of the 1990s, and the cloud computing explosion of the 2000s, and most people seem to think those were awesome. The current bot explosion also depends on APIs, but the jury is out (lol) on how awesome that one is.

The trial continues. Google concluded its case yesterday, and Oracle called its first witness, co-CEO Safra Catz. "We did not buy Sun to file this lawsuit," she said. Reassuring, but if they win there's going to be a lot of that going around. A lot.

For a much more in-depth look at the story behind the trial, this epic article by Sarah Jeong is awesome. Follow the rest of the events over the next few days on Ars Technica, Twitter, or wherever you get your news. Meanwhile on Agile*, we will return to normal geophysical programming, I promise :)


ADDENDUM on 26 May 2016... Google won the case with the "fair use" argument. So the appeal court's decision that APIs are copyrightable stands, but the jury were persuaded that this particular instance qualified as fair use. Oracle will appeal.

Deriving equations in Python

Last week I wrote about the elastic moduli, and showed the latest version of my table of equations. Here it is; click on it for a large version:

Making this grid was a bit of an exercise in itself. One could spend some happy hours rearranging things by hand; instead, I spent some (mostly) happy hours learning to use SymPy, a symbolic maths library for Python. For what it's worth, you can see my flailing in this Jupyter Notebook. Warning: it's pretty untidy.

Wrangling equations

Fortunately, SymPy is easy to get started with. Let's look at getting an expression for \(V_\mathrm{P}\) in terms of \(E\) and \(K\), given that I already have an expression in terms of \(E\) and \(\mu\), plus an expression for \(\mu\) in terms of \(E\) and \(K\).

First we import the SymPy library, set it up for nice math display in the Notebook, and initialize some parameter names:

 
>>> import sympy
>>> sympy.init_printing(use_latex='mathjax')
>>> lamda, mu, nu, E, K, rho = sympy.symbols("lamda, mu, nu, E, K, rho")

lamda is not a typo: lambda means something else in Python — it's a sort of unnamed function.

Now we're ready to define an expression. First, I'll import SymPy's own square root function for convenience. Then I define an expression for \(V_\mathrm{P}\) in terms of \(E\) and \(\mu\):

 
>>> vp_expr = sympy.sqrt((mu * (E - 4*mu)) / (rho * (E - 3*mu)))
>>> vp_expr

$$ \sqrt{\frac{\mu \left(E - 4 \mu\right)}{\rho \left(E - 3 \mu\right)}} $$

Now we can give SymPy the expression for \(\mu\) in terms of \(E\) and \(K\) and substitute:

 
>>> mu_expr = (3 * K * E) / (9 * K - E)
>>> vp_new = vp_expr.subs(mu, mu_expr)
>>> vp_new

$$\sqrt{3} \sqrt{\frac{E K \left(- \frac{12 E K}{- E + 9 K} + E\right)}{\rho \left(- E + 9 K\right) \left(- \frac{9 E K}{- E + 9 K} + E\right)}}$$

Argh, what is that?? Luckily, it's easy to simplify:

 
>>> sympy.simplify(vp_new)

$$\sqrt{3} \sqrt{\frac{K \left(E + 3 K\right)}{\rho \left(- E + 9 K\right)}}$$

That's more like it! What's really cool is that SymPy can even generate the \(\LaTeX\) code for your favourite math renderer:

 
>>> print(sympy.latex(sympy.simplify(vp_new)))
\sqrt{3} \sqrt{\frac{K \left(E + 3 K\right)}{\rho \left(- E + 9 K\right)}}

That's all there is to it!

What is the mystery X?

Have a look at the expression for  \(V_\mathrm{P}\) in terms of \(E\) and \(\lambda\):


$$\frac{\sqrt{2}}{2} \sqrt{\frac{1}{\rho} \left(E - \lambda + \sqrt{E^{2} + 2 E \lambda + 9 \lambda^{2}}\right)}$$

I find this quantity — I call it \(X\) in the big table of equations — really curious:


$$ X = \sqrt{9\lambda^2 + 2E\lambda + E^2} $$

As you can see from the similar table on Wikipedia, a similar quantity appears in expressions in terms of \(E\) and \(M\). These quantities look like elastic moduli, and even have the right units and order of magnitude as the others. If anyone has thoughts on what significance it might have, if any, or on why expressions in terms of \(E\) and \(\lambda\) or \(M\) should be so uncommonly clunky, I'm all ears. 

One last thing... I've mentioned Melvyn Bragg's wonderful BBC radio programme In Our Time before. If you like listening to the radio, try this recent episode on the life and work of Robert Hooke. Not only did he invent the study of elasticity with his eponymous law, he was also big in microscopy, describing things like the cellular structure of cork in detail (right).

Pick This again, again

Today we're proud to be launching the latest, all new iteration of Pick This!

Last June I told you about some new features we'd added to our social image interpretation tool. This new release is not really about features, but more about architecture. Late in 2015, we were challenged by BG Group, a UK energy company, to port the app to Amazon's cloud (AWS), so that they could run it in their own environment. Once we'd done that, we brought the data over from Google — where it was hosted — and set up the new public site on AWS. It will be much easier for us to add new features to this version.

One notable feature is that you no longer have to have a Google account to log in! This may have been a show-stopper for some people.

The app has been completely re-written from scratch, so there are a few differences. But fundamentally it's the same as before — you can ask your peers questions about images, and they can draw their answers. For example, Don Herron's "Where's the unconformity?" now has over 450 interpretations!

As we improve the tool over the coming weeks, we'll add ways to filter the results down, to attenuate some of the 'interpretation noise'. It's interesting to think about ways to represent this result — what is the 'true interpretation'? Is it the cloud of all opinions? Is there one answer?

Click here to visit the new site. For now it only plays nicely on a desktop computer (mobile is such a headache, but we will get there!). But you should be able to log in, interpret images, and upload new ones. You can let me know about bugs, or tweet @nowpickthis. If you like it, and I really hope you do, please tell your friends!


A quick reminder about the hackathon in Vienna next month. It will be an intense weekend of learning about programming and building some fun projects. I hope you can come, and if you know any geos in central Europe, please let them know!