Wave-particle duality

Geoblogger Brian Romans has declared it Dune Week (here's part of his tweet), so I thought I'd jump on the bandwagon with one of my favourite dynamic dune examples illustrating the manifold controls on dune shape. 

Barchan dunes and parabolic dunes both form where there is limited sand supply and unimodally-directed wind (that is, the wind always blows from the same direction). Barchans, like these in Qatar, migrate downwind as sand is blown around the tips of the crescent. Consequently, the slip face is concave.

Location: 24.98°N, 51.37°E

In contrast, parabolic dunes have a convex slip face. They form in vegetated areas: vegetation causes drag on the arms of the crescent, resulting in the elongated shape. These low-amplitude dunes in NE Brazil have left obvious trails.

Location: 3.41°S, 39.00°W


The eastern edge of White Sands dunefield in New Mexico shows an interesting transition from barchan to parabolic, as the marginal vegetation is encroached upon by these weird gypsum dunes. The mode transition runs more or less north–south. Can you tell which side is which? Which way does the wind blow?

View Larger Map

Herrmann and Duràn modelled this type of transition, among others, in a series of fascinating papers including this presentation and Durán et al  2007, Parabolic dunes in north-eastern Brazil, in arXiv Soft Condensed Matter. Their figures show how their numerical models represent nature quite well as barchans transition to parabolic dunes:
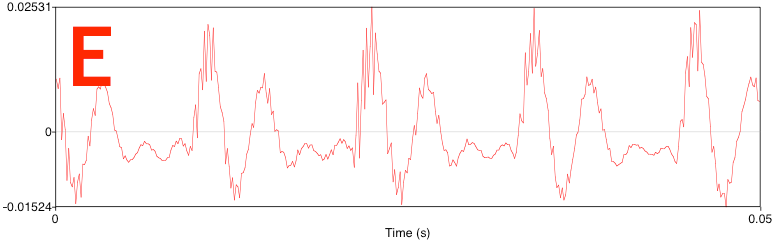
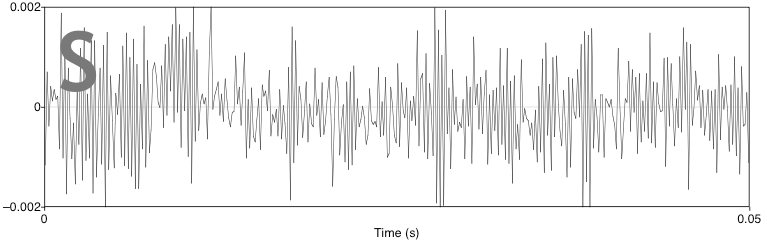
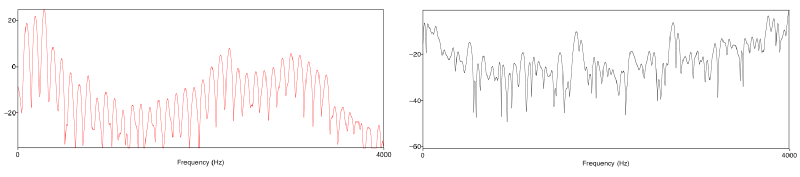
Duran_Herrmann_2006_Dunes.png

Please, sir, may I have some seismic petrophysics?

Petrophysics is an indispensible but odd corner of subsurface geoscience. I find it a bit of a paradox. On the one hand, well logs fill a critical gap between core and seismic. On the other hand, most organizations I've worked in are short of petrophysicists, sometimes—no, usually—without even recognizing it.

When a petrophysicist is involved in a project, they usually identify with the geologists, perhaps even calling themselves one. There’s a lot of concern for a good porosity curve, and the interpretation of the volume of clay and other mineralogical constituents. There’s also a lot of time for the reservoir engineer, who wants a reliable estimate of the reservoir pressure, temperature and water saturation (about 20–40% of the pore space is filled with water in an oil or gas field; it’s important to know how much). This is all good; these are important reservoir properties.

Incomplete and spiky logs in the uphole section of the Tunalik 1 well from the western edge of the National Petroleum Reserve in Alaska [click for larger image]. Image: USGSBut where is the geophysicist? Often, she is in her office, editing her own sonic log (called DT, the sonic is P-wave slowness), or QCing her own bulk density curve. Why? Because bulk density ρ and P-wave velocity VP together make the best estimate of acoustic impedance :

Acoustic impedance is the simplest way to compute a model seismic trace. We can compare this model trace to the real seismic data, recorded from the surface, to make the all-important connection between rocks and wiggles. The acoustic impedance curve determines what this model trace looks like, but we also need to know where it goes in the vertical travel-time domain. The sonic log comes into play again: it gives the best first estimate of seismic travel time. Since each sample is a measure of the time taken for a sound wave to travel the unit distance, it can be integrated for the total travel time. Yeah, that’s mathematics. It works.

In short, the logs are critical for doing any geophysics at all.

But they always need attention. Before we can use these logs, they must be quality checked and often edited. There is often a need to splice data form various logging runs together. The uphole sections are usually bad (there may be measurements in cased intervals, for example). Both of the logs are sensitive to hole condition. 

So the logs are critical, and always need fine-tuning. But I have yet to work on a project where a clean, top-to-tail DT and RHOB log are seen as a priority. Usually, they are not even on the List Of Things To Do. 

Result: the geophysicist gets on with it, and edits the logs. Now there's a DT_EDIT curve in the project. Oh, that name's been taken. And DT_Final and DT_edit2. I wonder who made those? DT_Matt then... but will anyone know what that is? No, and no-one will care either, because the madness will never end. 

There is even the risk of a greater tragedy: no geophysical logs at all. A missing or incomplete sonic because the tool was never run, or it failed and was not repeated, or it was just forgotten. No shear-wave sonic when you really just need a shear-wave sonic. No checkshots anywhere in the entire field, or the unedited data have been loaded in some horrible way. No VSPs anywhere, or no-one knows where the data are. Probably rotting on a 9-track tape somewhere in a salt cavern in Louisiana. 

Here's are some things to ask your friendly petrophysicist for:

  • A single, lightly edited, RHOB, DT, and DTS (if available) curve, from the top of the reliable data to the bottom.
  • If they're available, a set of checkshots with time and depth measured from the seismic datum (they are almost never recorded this way so have to be corrected).
  • Help understanding the controls on sonic and density with depth; for example, can we ascribe some portion of the trends to compaction, and some to diagenesis?
  • Help understanding the relationship between lithology and acoustic impedance. Filter the data to see how the impedance of sands and shales vary with depth.
  • If there are several wells with complete sets of logs and there's to be an attempt to model missing or incomplete logs, then the petrophysicist should be involved.

What have I missed? Is there more? Or maybe you think this is too much?

Last thing: when the petrophysicist is making his beautiful composite displays of the well data, ask him to include acoustic impedance, the reflection coefficients, the synthetic seismogram, and even the seismic traces from the well location. This will surprise people. In a good way.

Thin-bed vowels and heterolithic consonants

Seismologists see the world differently. Or, rather, they hear the world differently. Sounds become time series, musical notes become Fourier components. The notes we make with our vocal chords come from the so-called sonorants, especially the vowel sounds, and they look like this:

Consontants aren't as pretty, consisting of various obstruents like plosives and fricatives—these depend on turbulence, and don't involve the vocal chords. They look very different:

Geophysicists will recognize these two time series as being signal-dominated and noise-dominated, respectively. The signal in the vowel sound is highly periodic: a small segment about 12 ms long is repeated four times in this plot. There is no repeating signal in the consonant sound: it is more or less white noise.

When quantitative people hear the word periodic, their first thought is usually Fourier transform. Like a prism, the Fourier transform unpacks mixed signals into monotones, making them easier to examine and explain. For instance, the Fourier transform of a set of limestone beds might reveal the Milankovitch cycles of which I am so fond. What about S and E?

The spectrum of the consonant S is not very organized and close to being random. But the E sound has an interesting shape. It's quite smooth and has obvious repetitive notches. Any geophysicist who has worked with spectral decomposition—a technique for investigating thin beds—will recognize these. For example, compare the spectrums for a random set of reflection coefficients (what we might call background geology) and a single thin bed, 10 ms thick:

Notches! The beauty of this, from an interpreter's point of view, is that one can deduce the thickness of the thin-bed giving rise to this notchy spectrum. The thickness is simply 1/n, where n is the notch spacing, 100 Hz in this case. So the thickness is 1/100 = 0.01 s = 10 ms. We can easily compute the spectrum of seismic data, so this is potentially powerful.

While obvious here, in a complicated spectrum the notches might be hard to detect and thus measure. But the notches are periodic. And what do we use to find periodic signals? The Fourier transform! So what happens if we take the spectrum of the spectrum of my voice signal—where we saw a 12 ms repeating pattern?

There's the 12 ms periodic signal from the time series! 

The spectrum of the spectrum is called the cepstrum (pronounced, and sometimes spelled, kepstrum). We have been transported from the frequency domain to a new universe: the quefrency domain. We are back with units of time, but there are other features of the cepstral world that make it quite different from the time domain. I'll discuss those in a future post. 

Based on a poster paper I presented at the 2005 EAGE Conference & Exhibition in Madrid, Spain, and on a follow-up article Hall, M (2006), Predicting bed thickness with cepstral decomposition, The Leading Edge, February 2006, doi:10.1190/1.2172313

McKelvey's reserves and resources

Vincent McKelvey (right) was chief geologist at the US Geological Survey, and then its director from 1971 until 1977. Rather like Sherman Kent at the CIA, who I wrote about last week, one of his battles was against ambiguity in communication. But rather than worrying about the threat posed by the Soviet Union or North Korea, his concern was the reporting of natural resources in the subsurface of the earth. Today McKelvey's name is associated with a simple device for visualizing levels of uncertainty and risk associated with mineral resources: the McKelvey box.

Here (left) is a modernized version. It helps unravel some oft-heard jargon. The basic idea is that only discovered, commercially-viable deposits get to be called Reserves. Discovered but sub-commercial (with today's technology and pricing) are contingent resources. Potentially producible and viable deposits that we've not yet found are called prospective resources. These are important distinctions, especially if you are a public company or a government.

Over time, this device has been reorganized and subdivided with ever more subtle distinctions and definitions. I was uninspired by the slightly fuzzy graphics in the ongoing multi-part review of reserve reporting in the CSPG Reservoir magazine (Yeo and Derochie, 2011, Reserves and resources series, CSPG Reservoir, starting August 2011). So I decided to draw my own version. To reflect the possiblity that there may yet be undreamt-of plays out there, I added a category for Unimagined resources. One for the dreamers.

You can find the Scalable Vector Graphics file for this figure in SubSurfWiki. If you have ideas about other jargon to add, or ways to represent the uncertainty, please have a go at editing the wiki page, the figure, or drop us a line!

Are you a poet or a mathematician?

Woolly ramsMany geologists can sometimes be rather prone to a little woolliness in their language. Perhaps because you cannot prove anything in geology (prove me wrong), or because everything we do is doused in interpretation, opinion and even bias, we like to beat about the bush. A lot.

Sometimes this doesn't matter much. We're just sparing our future self from a guilty binge of word-eating, and everyone understands what we mean—no harm done. But there are occasions when a measure of unambiguous precision is called for. When we might want to be careful about the technical meanings of words like approximately, significant, and certain.

Sherman Kent was a CIA analyst in the Cold War, and he tasked himself with bringing quantitative rigour to the language of intelligence reports. He struggled (and eventually failed), meeting what he called aesthetic opposition:

Sherman Kent portraitWhat slowed me up in the first instance was the firm and reasoned resistance of some of my colleagues. Quite figuratively I am going to call them the poets—as opposed to the mathematicians—in my circle of associates, and if the term conveys a modicum of disapprobation on my part, that is what I want it to do. Their attitude toward the problem of communication seems to be fundamentally defeatist. They appear to believe the most a writer can achieve when working in a speculative area of human affairs is communication in only the broadest general sense. If he gets the wrong message across or no message at all—well, that is life.

Sherman Kent, Words of Estimative Probability, CIA Studies in Intelligence, Fall 1964

Words of estimative probabilityKent proposed using some specific words to convey specific levels of certainty (right). We have used these words in our mobile app Risk*. The only modification I made was setting P = 0.99 for Certain, and P = 0.01 for Impossible (see my remark about proving things in geology).

There are other schemes. Most petroleum geologists know Peter Rose's work. A common language, with some quantitative meaning, can dull the pain of prospect risking sessions. Almost certainly. Probably.

Do you use systematic descriptions of uncertainty? Do you think they help? How can we balance our poetic side of geology with the mathematical?

The cratering hypothesis

A few years ago, I was interpreting the Devonian of northern Alberta in a beautiful 3D seismic reflection survey. Because the target zone was rather shallow, we had acquired a dataset with a very high trace density: a lot of spatial samples. This gave us a lot of detail in timeslices, even if the vertical section views weren't particularly high resolution in these deeper, high velocity sediments of the shallow Givetian carbonate seas.

A circular feature caught my eye. Unfortunately I can't show it to you because the data are proprietary, but it was quite conspicuous and impossible to ignore: perfectly round, about 1.5 km across, and with a central mound a couple of hundred metres in diameter. I showed it to a few people and everyone said, 'yeah, impact crater'. Or maybe I just always heard 'impact crater'. 

I really wanted it to be an impact crater. Bias number 1. 

My first action was to re-read one of my favourite papers ever: Simon Stewart's 1999 paper on circular geological features. I love papers like this: basic, practical advice for interpreters. His figure 1 (left) is a lovely graphic. Stewart himself is rather enamoured with impact structures—he was the 'for' advocate in the recent debate over the Silverpit structure in the North Sea. You can read some more about it here and here

The paper gives some equations which compute the probability that, given some assumptions about meteorite flux and so forth, a bolide has cratered right where you are standing at some point in geological history. I built this little Wolfram|Alpha Widget so you can try them yourself (need help?). Of course, this is far from the same thing as there being a crater preserved, or visible in seismic, but it's a start. Bias number 2: Numbers, even dubious ones, look like evidence.

I admit it, I got carried away. Bias number 3.

But then... we shot another survey. There turned out to be another crater. And then another. My biases weren't enough—new craters finished it. According to those equations, the probability of having one in a 600 km2 survey spanning 200 Ma of preservable time is 0.14, a 14% chance. Pretty good. But the probability of two is 0.012, and three is 0.0007. And these were contemporaneous. And, just as with Silverpit, there was salt. 

It should have been obvious all along. (Bias number 4.)

Reference
Stewart, S (1999). Seismic interpretation of circular geological structures. Petroleum Geoscience 5, p 273–285. DOI: 10.1144/petgeo.5.3.273

Image from Stewart 1999 is copyright of the Geological Society of London and the European Association of Geoscientists and Engineers, and is used here with permission and with thanks.

Four days of oil

The long-awaited news of oil in the Falkland Islands arrived in May last year when UK company Rockhopper Exploration drilled a successful well in the North Falkland Basin. After testing a second well, the estimated volume of recoverable oil in the field, called Sea Lion, was upped last month to 325 million barrels. A barrel is one bathtub, or 42 gallons, or 159 litres, or 0.159 m3. Let's be scientific and stick to SI units: the discovery is about 52 million cubic metres. Recoverable means the oil can be produced with foreseeable technology; about half the oil will likely not be produced and remain in the ground forever. Or until humans are desperate enough to get it out.

On its own, a claim of 325 million barrels is meaningless to those outside the oil business. But this is a good-sized discovery, certainly a company-maker for a small player like Rockhopper. But as we read news of recent big discoveries in the Gulf of Mexico by BP, Chevron and ExxonMobil, it's worth having some sort of yardstick to help visualize these strange units and huge numbers...

Read More

Workshop? Talkshop

Day 4 of the SEG Annual Meeting. I attended the workshop entitled Geophysical data interpretation for unconventional reservoirs. It was really about the state of the art of seismic technologies for shale gas exploration and exploitation, but an emergent theme was the treatment of the earth as an engineering material, as opposed to an acoustic or elastic medium.

Harvey Goodman from Chevron started the workshop by asking the packed room, "are there any engineers in the room?" Hilariously, a single lonesome hand was raised. "Well," he said "this talk is for you." Perhaps this wasn't the venue for it; so much for spreading cross-disciplinary love and the geophysical technical vernacular. 

Mark Zoback from Stanford presented decades worth of laboratory measurements on the elastic/plastic properties of shales. Specifically the concentrations of illite and TOC on mechanical stiffness and creep. When it came to questions, he provided the most compentent and cogent responses of the day: every one was gold. Your go-to guy for shale geomechanics.

Marita Gading of Statoil presented some facinating technology called Source Rock from Seismic (we mentioned this on Monday)—a way to estimate total organic carbon from seismic for basin modeling and play evaluation. She listed the factors controling acoustic properties of shales as

  1. organic content;
  2. compaction or porosity;
  3. lithotype and mineral composition;
  4. seismic to microscale anisotropy.

She showed an empirically derived acoustic impedance transform coupled with more interpretive methods, and the results are compelling. It's not clear how well this might work in ancient shales onshore, but it has apparently worked for Statoil in younger, offshore basins.

Galen Treadgold from Global Geophysical gave a visually stunning presentation showing the value of expansive data sets in the Eagle Ford shale. He showed 1000 km2 of 3D seismic that had been stitched together, highlighting the need to look at a regional picture. Patchwork data fails to give the same clarity of variation in mechanical stratigraphy.

The session shifted to the state of microseismic technology and 'getting beyond the dots'. Speakers from rival companies MicroSeismic, ESG Solutions, and Pinnacle described how microseismic waveforms are now being used to resolve moment tensors. These provide not only the location and magnitude but also the failure characteristic of every single event. While limited by uncertainty, they may be the way to get the industry beyond the prevailing bi-wing paradigm.

The session was a nice blend of disciplines, with ample time for question and answer. I struggle though to call it a workshop, it felt like a continuation of the huge number of talks that have been going on in the same room all week. Have you ever been to a stellar workshop? What made it great? 

More from our SEG 2011 experience.

Curvelets, dreamlets, and a few tears

Day 3 of the SEG Annual Meeting came and went in a bit of a blur. Delegates were palpably close to saturation, getting harder to impress. Most were no longer taking notes, happy to let the geophysical tide of acoustic signal, and occasional noise, wash over them. Here's what we saw.

Gilles Hennenfent, Chevron

I (Evan) loved Gilles's talk Interpretive noise attenuation in the curvelet domain. For someone who is merely a spectator in the arena of domain transforms and noise removal techniques, I was surprised to find it digestable and well-paced. Coherent noise can be difficult to remove independently from coherent signal, but using dyadic partitions of the frequency-wavenumber (f-k) domain, sectors called curvelets can be muted or amplified for reducing noise and increasing signal. Curvelets have popped up in a few talks, because they can be a very sparse representation of seismic data.

Speaking of exotic signal decompositions, Ru-Shan Wu, University of California at Santa Clara, took his audience to new heights, or depths, or widths, or... something. Halfway through his description of the seismic wavefield as a light-cone in 4D Fourier time-space best characterized by drumbeat beamlets—or dreamlets—we realized that we'd fallen through a wormhole in the seismic continuum and stopped taking notes.

Lev Vernik, Marathon

Lev dished a delicious spread of tidbits crucial for understanding the geomechanical control on hydraulic fracture stimulations. It's common practice to drill parallel to the minimum horizontal stress direction to optimize fracture growth away from the well location. For isotropic linear elastic fracture behaviour, the breakdown pressure of a formation is a function of the maximum horizontal stress, the vertical stress, the pore pressure, and the fracture toughness. Unfortunately, rocks we'd like to frack are not isotropic, and need to be understood in terms of anisotropy and inelastic strains.

Lastly, we stopped in to look at the posters. But instead of being the fun-fest of awesome geoscience we were looking forward to (we're optimistic people), it was a bit of a downer and made us rather sad. Posters are often a bit unsatisfactory for the presenter: they are difficult to make, and often tucked away in a seldom-visited corner of the conference. But there was no less-frequented corner of San Antonio, and possibly the state of Texas, than the dingy poster hall at SEG this year. There were perhaps 25 people looking at the 400-or-so posters. Like us, most of them were crying.

More posts from SEG 2011.

Randomness and thin beds

Day 2 of the SEG Annual Meeting brought another 93 talks in the morning, and 103 in the afternoon, leaving us bewildered again: how to choose ten or so talks to see? (We have some ideas on this, more of which another day). Matt tried just sitting through a single session (well, almost), whereas Evan adopted the migrant approach again. These are our picks, just for you.

Stewart Trickett, Kelman

There has never been a dull or difficult talk from Stewart, one of Calgary's smartest and most thoughtful programmer–processors. He has recently addressed the hot-topic of 5D interpolation, a powerful process for making the dream of cheap, dense sampling a reality. Today, he explained why we need to now think about optimizing acquisition not for imaging, but for interpolation. And interpolation really likes pseudorandom sampling, because it helps negotiate the terms & conditions of Nyquist and avoid spatial aliasing. He went on to show a 3D subsampled then imaged three ways: remove every other shot line, remove every other shot, or remove a random shot from every pair of shots. All reduce the fold to 12% of the full data. The result: pseudorandom sampling wins every time. But don't panic, the difference in the migrated images was much smaller than in the structure stacks.

Gaynor Payton, ffA

In what could have been a product-focused marketing talk, Gaynor did a good job of outlining five easy-to-follow, practical workflows for interpreters working on thin beds. She showed frequency- and phase-based methods that exploit near-tuning, unresolved doublets in the waveform. A nice-looking bandwidth enhancement result was followed up with ffA's new high-resolution spectral decomposition we covered recently. Then she showed how negative spikes in instantaneous frequency can reveal subtle doublets in the waveform. This was extended with a skeletonized image, a sort of band-limited reflectivity display. Finally, she showed an interesting display of signed trace slope, which seemed to reveal the extent of just-resolved doublets quite nicely.

Scott Mackay, consultant

Scott MacKay shared some of his deep experience with depth imaging, but specially translated for interpreters. And this is only right: depth imaging is first and foremost an interpretive, iterative process, not a product. He gave some basic heuristics, guiding principles for interpreters. The first velocity model should be smooth—really smooth. Iterations should be only incrementally less smooth, 'creeping up' on the solution. Structure should get less, not more, complex with each step. Gathers should be flattish, not flat. Be patient, and let the data speak. And above all, Don't Panic. Always good advice.

More posts about SEG 2011.