Geophysics at SciPy 2014

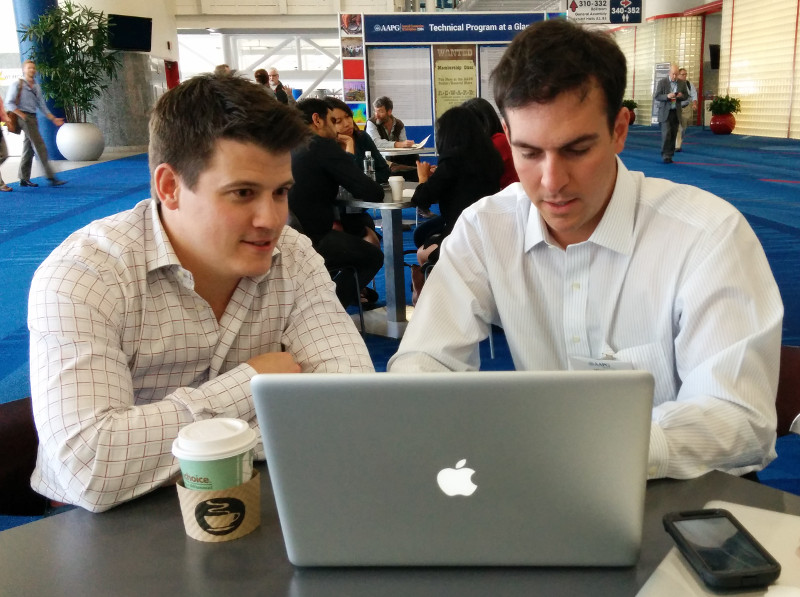
Wednesday was geophysics day at SciPy 2014, the conference for scientific Python in Austin. We had a mini-symposium in the afternoon, with 4 talks and 2 lightning talks about posters.

All the talks

Here's what went on in the session...

The talks should all be online eventually. For now, you can watch my talk and Joe's (awesome) talk right here...

And also...

There have been so many other highlights at this amazing conference that I can't resist sharing a couple of the non-geophysical gems...

Last thing... If you use the scientific Python stack in your work, please consider giving as generously as you can to the NumFOCUS Foundation. Support open source!

SciPy will eat the world... in a good way

We're at the SciPy 2014 conference in Austin, the big giant meetup for everyone into scientific Python.

One surprising thing so far is the breadth of science and computing in play, from astronomy to zoology, and from AI to zero-based indexing. It shouldn't have been surprising, as SciPy.org hints at the variety:

There's really nothing you can't do in the scientific Python ecosystem, but this isn't why SciPy will soon be everywhere in science, including geophysics and even geology. I think the reason is IPython Notebook, and new web-friendly ways to present data, directly from the computing environment to the web — where anyone can see it, share it, interact with it, and even build on it in their own work.

Teaching STEM

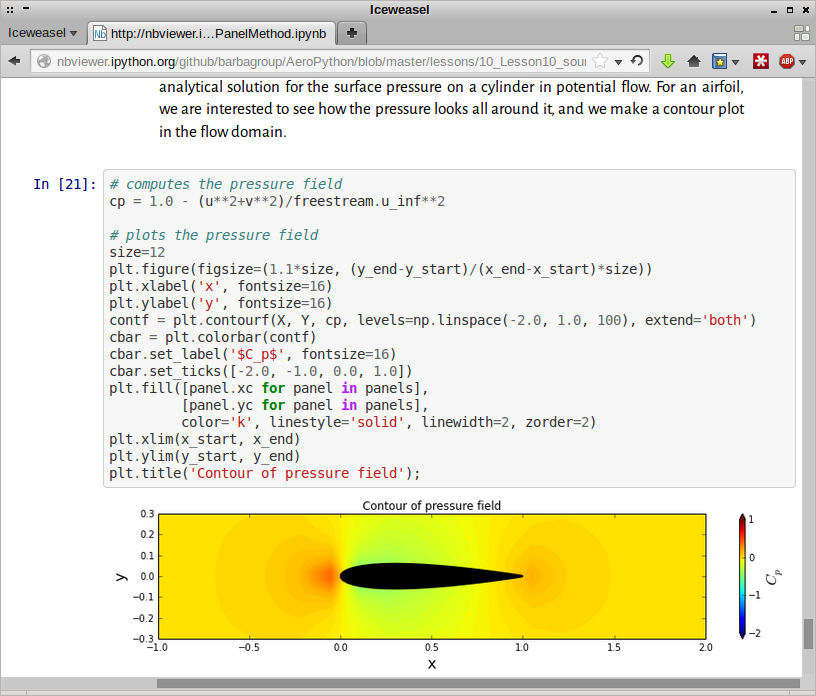
In Tuesday's keynote, Lorena Barba, an uber-prof of engineering at The George Washington University, called IPython Notebook the killer app for teaching in the STEM fields. She has built two amazing courses in Notebook: 12 Steps to Navier–Stokes and AeroPython (right), and more are on the way. Soon, perhaps through Jupyter CoLaboratory (launching in alpha today), perhaps with the help of tools like Bokeh or mpld3, the web versions of these notebooks will be live and interactive. Python is already the new star of teaching computer science, web-friendly super-powers will continue to push this.

Let's be extra clear: if you are teaching geophysics using a proprietary tool like MATLAB, you are doing your students a disservice if you don't at least think hard about moving to Python. (There's a parallel argument for OpedTect over Petrel, but let's not get into that now.)

Reproducible and presentable

Can you imagine a day when geoscientists wield these data analysis tools with the same facility that they wield other interpretation software? With the same facility that scientists in other disciplines are already wielding them? I can, and I get excited thinking about how much easier it will be to collaborate with colleagues, document our workflows (for others and for our future selves), and write presentations and papers for others to read, interact with, and adapt for their own work.

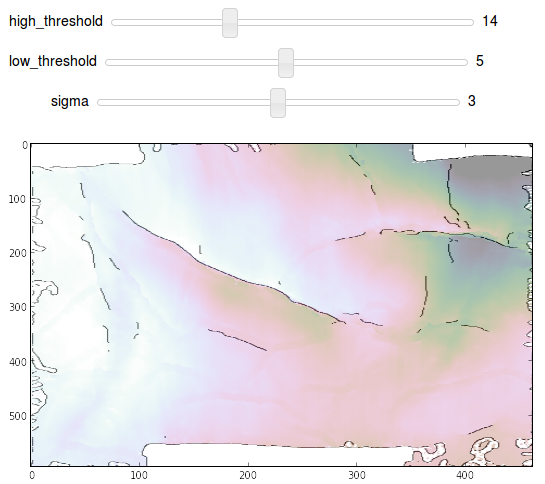
To whet your appetite, here's the sort of thing I mean (not interactive, but here's the code)...

If you agree that it's needed, I want to ask: What traditions or skill gaps are in the way of this happening? How can our community of scientists and engineers drive this change? If you disagree, I'd love to hear why.

Looking forward to SciPy 2014

This week the Agile crew is at the SciPy conference in Austin, Texas. SciPy is a scientific library for the Python programming language, and the eponymous conference is the annual meetup for the physicists, astonomers, economists — and even the geophysicists! — that develop and use SciPy.

What is SciPy?

Python is an awesome high-level programming language. It's awesome because...

  • Python is free and open source.
  • Python is easy to learn and quite versatile.
  • Python has hundreds of great open source extensions, called libraries.
  • The Python ecosystem is actively developed by programmers at Google, Enthought, Continuum, and elsewhere.
  • Python has a huge and talkative user community, so finding help is easy.

All of these factors make it ideal for crunching and visualizing scientific data. The most important of these is NumPy, which provides efficient linear algebra operations — essential for handling big vectors and matrices. SciPy builds on NumPy to provide signal processing, statistics, and optimization. There are other packages in the same ecosystem for plotting, data management, and so on.

If you follow this blog, you know we have been getting into code lately. We think that languages like Python, GNU Octave, and R (a stastical language) are a core competency for geoscientists. That's why we want to help geoscientists learn Python, and why we organize hackathons, and why we keep going on about it on the blog.

What's going on in Austin?

Technical organizers Katy Huff and Serge Rey have put together a fantastic schedule including 2 days of tutorials (already underway), 3 days of technical talks and posters, and 2 days of sprints (focused coding sessions). Interspersed throughout the talk days are 'Birds of a Feather' meetups for various special-interest groups, and more social gatherings. It's exactly what a scientific conference should be: active learning, content, social, hacking, and unstructured discussion.

Here are some of the things I'm most looking forward to:

If you're interested in hearing about what's going on in this corner of the geophysical and scientific computing world, tune in this week to read more. We'll be posting regularly to the blog, or you can follow along on the #SciPy2014 Twitter hashtag.

Cross sections into seismic sections

We've added to the core functionality of modelr. Instead of creating an arbitrarily shaped wedge (which is plenty useful in its own right), users can now create a synthetic seismogram out of any geology they can think of, or extract from their data.

Turn a geologic-section into an earth model

We implemented a color picker within an image processing scheme, so that each unique colour gets mapped to an editable rock type. Users can create and manage their own rock property catalog, and save models as templates to share and re-use. You can use as many or as few colours as you like, and you'll never run out of rocks.

To give an example, let's use the stratigraphic diagram that Bruce Hart used in making synthetic seismic forward models in his recent Whither seismic stratigraphy article. There are 7 unique colours, so we can generate an earth model by assigning a rock to each of the colours in the image.

If you can imagine it, you can draw it. If you can draw it, you can model it.

Modeling as an interactive experience

We've exposed parameters in the interface and so you can interact with the multidimensional seismic data space. Why is this important? Well, modeling shouldn't be a one-shot deal. It's an iterative process. A feedback cycle where you turn knobs, pull levers, and learn about the behaviour of a physical system; in this case it is the interplay between geologic units and seismic waves. 

A model isn't just a single image, but a swath of possibilities teased out by varying a multitude of inputs. With modelr, the seismic experiment can be manipulated, so that the gamut of geologic variability can be explored. That process is how we train our ability to see geology in seismic.

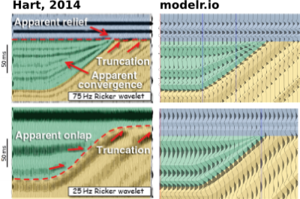
Hart's paper doesn't specifically mention the rock properties used, so it's difficult to match amplitudes, but you can see here how modelr stands up next to Hart's images for high (75 Hz) and low (25 Hz) frequency Ricker wavelets.

There are some cosmetic differences too... I've used fewer wiggle traces to make it easier to see the seismic waveforms. And I think Bruce forgot the blue strata on his 25 Hz model. But I like this display, with the earth model in the background, and the wiggle traces on top — geology and seismic blended in the same graphical space, as they are in the real world, albeit briefly.


Subscribe to the email list to stay in the loop with modelr news, or sign-up at modelr.io and get started today.

This will add you to the email list for the modeling tool. We never share user details with anyone. You can unsubscribe any time.

Seismic models: Hart, BS (2013). Whither seismic stratigraphy? Interpretation, volume 1 (1). The image is copyright of SEG and AAPG.

Slicing seismic arrays

Scientific computing is largely made up of doing linear algebra on matrices, and then visualizing those matrices for their patterns and signals. It's a fundamental concept, and there is no better example than a 3D seismic volume.

Seeing in geoscience, literally

Digital seismic data is nothing but an array of numbers, decorated with header information, sorted and processed along different dimensions depending on the application.

In Python, you can index into any sequence, whether it be a string, list, or array of numbers. For example, we can index into the fourth character (counting from 0) of the word 'geoscience' to select the letter 's':

>>> word = 'geosciences'
>>> word[3]
's'

Or, we can slice the string with the syntax word[start:end:step] to produce a sub-sequence of characters. Note also how we can index backwards with negative numbers, or skip indices to use defaults:

>>> word[3:-1]  # From the 4th character to the penultimate character.
'science'
>>> word[3::2]  # Every other character from the 4th to the end.
'sine'

Seismic data is a matrix

In exactly the same way, we index into a multi-dimensional array in order to select a subset of elements. Slicing and indexing is a cinch using the numerical library NumPy for crunching numbers. Let's look at an example... if data is a 3D array of seismic amplitudes:

timeslice = data[:,:,122] # The 122nd element from the third dimension.
inline = data[30,:,:]     # The 30th element from the first dimension.
crossline = data[:,60,:]  # The 60th element from the second dimension.

Here we have sliced all of the inlines and crosslines at a specific travel time index, to yield a time slice (left). We have sliced all the crossline traces along an inline (middle), and we have sliced the inline traces along a single crossline (right). There's no reason for the slices to remain orthogonal however, and we could, if we wished, index through the multi-dimensional array and extract an arbitrary combination of all three.

Questions involving well logs (a 1D matrix), cross sections (2D), and geomodels (3D) can all be addressed with the rigours of linear algebra and digital signal processing. An essential step in working with your data is treating it as arrays.

View the notebook for this example, or get the get the notebook from GitHub and play with around with the code.

Sign up!

If you want to practise slicing your data into bits, and other power tools you can make, the Agile Geocomputing course will be running twice in the UK this summer. Click one of the buttons below to buy a seat.

Eventbrite - Agile Geocomputing, Aberdeen

Eventbrite - Agile Geocomputing, London

More locations in North America for the fall. If you would like us to bring the course to your organization, get in touch.

Saving time with code

A year or so ago I wrote that...

...every team should have a coder. Not to build software, not exactly. But to help build quick, thin solutions to everyday problems — in a smart way. Developers are special people. They are good at solving problems in flexible, reusable, scalable ways.

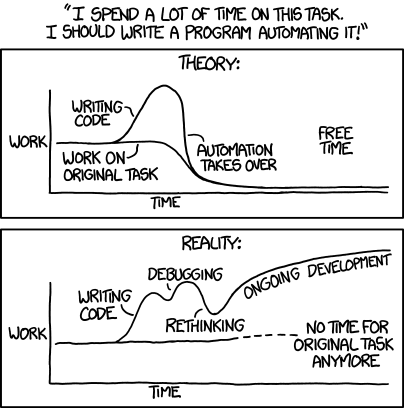
Since writing that, I've written more code than ever. I'm not ready to say that my starry-eyed vision of a perfect world of techs-cum-coders, but now I see that the path to nimble teams is probably paved with long cycle times, and never-ending iterations of fixing bugs and writing documentation.

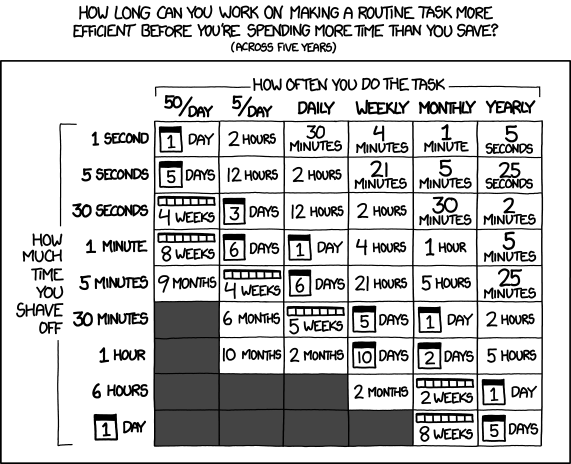
So potentially we replace the time saved, three times over, with a tool that now needs documenting, maintaining, and enhancing. This may not be a problem if it scales to lots of users with the same problem, but of course having lots of users just adds to the maintaining. And if you want to get paid, you can add 'selling' and 'marketing' to the list. Pfff, it's a wonder anybody ever makes anthing!

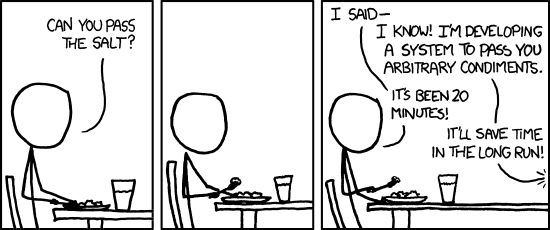
At least xkcd has some advice on how long we should spend on this sort of thing...

All of the comics in this post were drawn by and are copyright of the nonpareil of geek cartoonery, Randall Munroe, aka xkcd. You should subscribe to his comics and his What If series. All his work is licensed under the terms of Creative Commons Attribution Noncommercial.

Mining innovation

by Jelena Markov and Tom Horrocks

Jelena is a postgraduate student and Tom is a research assistant at the University of Western Australia, Perth. They competed in the recent RIIT Unearthed hackathon, and kindly offered to tell us all about it. Thank you, Jelena and Tom!

Two weeks ago Perth coworking space Spacecubed hosted a unique 54-hour-long hackathon focused on the mining industry. Most innovations in the mining industry are the result of long-term strategic planning in big mining companies, or collaboration with university groups. In contrast, the Unearthed hackathon provided different perspectives on problems in the mining domain by giving 'outsiders' a chance to work on industry problems.

The event attracted web-designers, software developers, data gurus, and few geology and geophysics geeks, all of whom worked together on data — both open and proprietary from the Western Australian Government and industry respectively — to deliver time-constrained solutions to problems in the mining domain. There were around 100 competitors divided into 18 teams, but just one underlying question: can web-designers and software developers create solutions that compete, on an innovative level, with those from the R&D divisions of mining companies? Well, according to panel of mining executives and entrepreneurs, they can.

Safe, seamless shutdown

The majority of the teams chose to work on logistic problems in mining production. For example, the Stockphiles worked on a Rio Tinto problem about how to efficiently and safely shut down equipment without majorly disturbing the overall system. Their solution used Directed Acyclic Graphs as the basis for an interactive web-based interface that visualised the impacted parts of the system. Outside of the mining production domain, however, two teams tackled problems focused on geology and geophysics...

Geoscience hacking

The team Ultramafia used augmented reality and cloud-based analysis to visualize geological mapping, with the underlying theme of the smartphone replacing the geological hammer, and also the boring task of joint logging!

The other team in this domain — and the team we were part of — was 50 Grades of Shale...
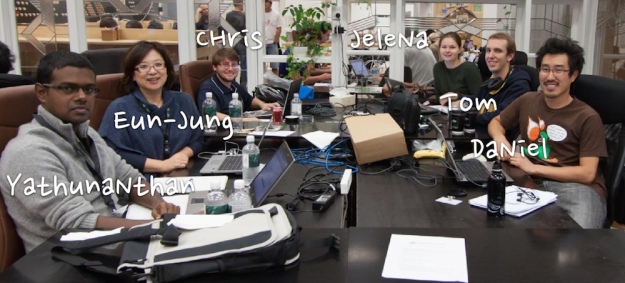
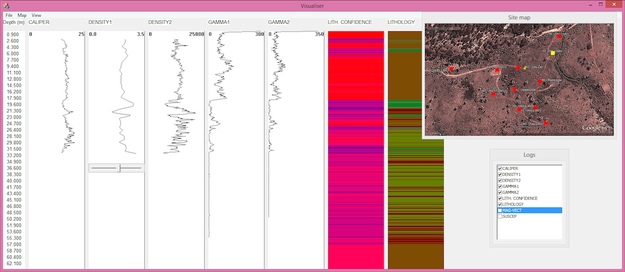
The team consisted of three PhD students and three staff members from the Centre for Exploration Targeting at the UWA. We created an app for real-time downhole petrophysical data analysis — dubbed Wireline Spelunker — that automatically classifies lithology types from wireline logs and correlates user-selected log segments across the drill holes. We used some public libraries for machine learning and signal analysis algorithms, and within 54 hours the team had implemented a workflow and interface, using data from the government database.
The boulder detection problem

The first prize, a 1 oz gold medal, was awarded to Applied Mathematics, who came up with an extraordinary use of accelerometers. They worked on Rio Tinto's 'boulder detection' problem — early detection of a large rocks loaded into mining trucks in order to prevent crusher malfunctions later in the process, which could ultimately cost $250,000 per hour in lost revenue. The team's solution was to detect large boulders by measuring the truck's vibrations during loading.

Second and third prizes went to Pit IQ and The Froys respectively. Both teams worked on data visualization problems on the mine site, and came up with interactive mobile dashboards.

A new role for Perth?

Besides having a chance to tackle problems that are costing the mining industry millions of dollars a year, this event has demonstrated that Perth is not just a mining hub but also has potential for something else.

This potential is recognized by event organizers Resources Innovation through Information Technology — Zane, Justin, Paul, and Kevin. They see potential in Perth as a centre for tech start-ups focused on the resource industry. Evidently, the potential is huge.

Follow Jelena on Twitter
Private public data

Our recent trip to the AAPG Annual Convention in Houston was much enhanced by meeting some inspiring geoscientist–programmers. People like...

  • Our old friend Jacob Foshee hung out with us and built his customary awesomeness.
  • Wassim Benhallam, at the University of Utah, came to our Rock Hack and impressed everyone with his knowledge of clustering algorithms, and sedimentary geology.
  • Sebastian Good, of Palladium Consulting, is full of beans and big ideas — and is a much more accomplished programmer than most of us will ever be. If you're coding geoscience, you'll like his blog.
  • We had a laugh with Nick Thompson from Schlumberger, who we bumped into at a 100% geeky meet-up for Python programmers interested in web sockets. I cannot explain why we were there.

Perhaps the most animated person we met was Ted Kernan (right). A recent graduate of Colorado School of Mines, Ted has taught himself PHP, one of the most prevalent programming languages on the web (WordPress, Joomla, and MediaWiki are written in PHP). He's also up on all the important bits of web tech, like hosting, and HTML frameworks.

But the really cool thing is what he's built: a search utility for public well data in the United States. You can go and check it out at publicwelldata.com — and if you like it, let Ted know!

Actually, that's not even the really cool thing. The really cool thing is how passionate he is about exposing this important public resource, and making it discoverable and accessible. He highlights the stark difference between Colorado's easy access to digital well data, complete with well logs, and the sorry state of affairs in North Dakota, where he can't even get his app in to read well names. 'Public data' can no longer mean "we'll sell you a paper printout for $40". It belongs on the web — machines can read too.

More than just wells

There's so much potential power here — not only for human geoscientists looking for well data, but also for geoscientist–programmers building tools that need well data. For example, I imagine being able to point modelr.io at any public well to grab its curves and make a quick synthetic. Ready access to open services like Ted's will free subsurface software from the deadweight of corporate databases filled with years of junk, and make us all a bit more nimble. 

We'll be discussing open data, and openness in general, at the Openness Unsession in Calgary on the afternoon of 12 May — part of GeoConvention 2014. Join us!

Hacking logs

Over the weekend, 6 intrepid geologist-geeks gathered in a coworking space in the East Downtown area of Houston. With only six people, I wasn't sure we could generate the same kind of creative buzz we had at the geophysics hackathon last September. But sitting with other geoscientists and solving problems with code works at any scale. 

The theme of the event was 'Doing cool things with log data'. There were no formal teams and no judging round. Nonetheless, some paired up in loose alliances, according to their interests. Here's a taste of what we got done in 2 days...

Multi-scale display

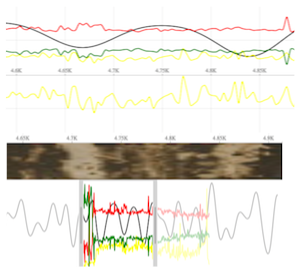
Jacob Foshee and Ben Bougher worked on some JavaScript to display logs with the sort of adaptive scrolling feature you often see on finance sites for displaying time series. The challenge was to display not just one log with its zoomed version, but multiple logs at multiple scales — and ideally core photos too. They got the multiple logs, though not yet at multiple scales, and they got the core photo. The example (right) shows some real logs from Panuke, a real core photo from the McMurray, and a fake synthetic seismogram. 

Click on the image for a demo. And the code is all open, all the way. Thanks guys for an awesome effort!

Multi-scale log attributes

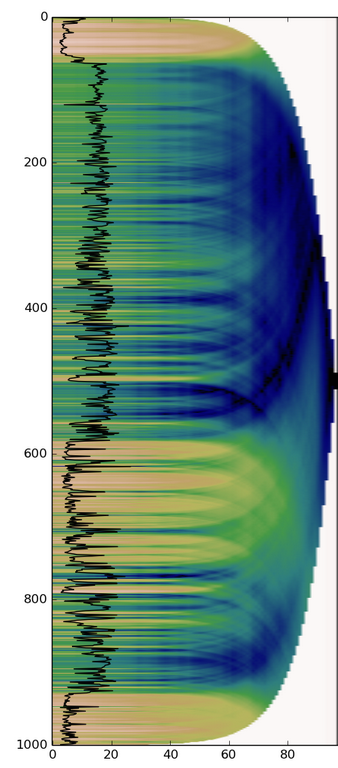
Evan and Mark Dahl (ConocoPhillips) — who was new to Python on Friday — built some fascinating displays (right). The idea was to explore stratigraphic stacking patterns in scale space. It's a little like spectral decomposition for 1D data. They averaged a log at a range of window sizes, increasing exponentially (musicians and geophysicists know that scale is best thought of in octaves). Then they made a display that ranges from short windows on the left-hand side to long ones on the right. Once you get your head around what exactly you're looking at here, you naturally want to ask questions about what these gothic-window patterns mean geologically (if anything), and what we can do with them. Can we use them to help train a facies classifier, for example? [Get Evan's code]

Facies from logs

In between running for tacos, I worked on computing grey-level co-occurence matrices (GLCMs) for logs, which are a prerequisite for computing certain texture attributes. Why would anyone do this? We'd often like to predict facies from well logs; maybe log textures (spiky vs flat, upwards-fining vs barrel-shaped) can help us discriminate facies better. [Download my IPython Notebook]

Wassim Benhallam (of Lisa Stright's Rocks to Models lab at University of Utah) worked on machine learning algorithms for computing facies from core. He started pursuing self-organizing maps as an interesting line of attack, and plans to use MATLAB to get something working. I hope he tells us how it goes!

We didn't have a formal contest at this event, but our friend Maitri Erwin was kind enough to stop by with some excellent wine and her characteristically insightful and inquisitive demeanour. After two days rattling around with nothing but geeks and tacos for company, she provided some much-needed objectivity and gave us all good ideas about how to develop our efforts in the coming weeks. 

We'll be doing this again in Denver this autumn, some time around the SEG Annual Meeting. If it appeals to your creativity — maybe there's a tool you've always wished for — why not plan to join us?  

As I get around to it, I'll be dumping more info and pictures over on the wiki

Getting started with Modelr

Let's take a closer look at modelr.io, our new modeling tool. Just like real seismic experiments, there are four components:

  • Make a framework. Define the geometries of rock layers.
  • Make an earth. Assign a set of rock properties to each layer.
  • Make a kernel. Define the seismic survey.
  • Make a plot. Set the output parameters.

Modelr takes care of the physics of wave propagation and reflection, so you don't have to stick with normal incidence acoustic impedance models if you don't want to. You can explore the full range of possibilities.

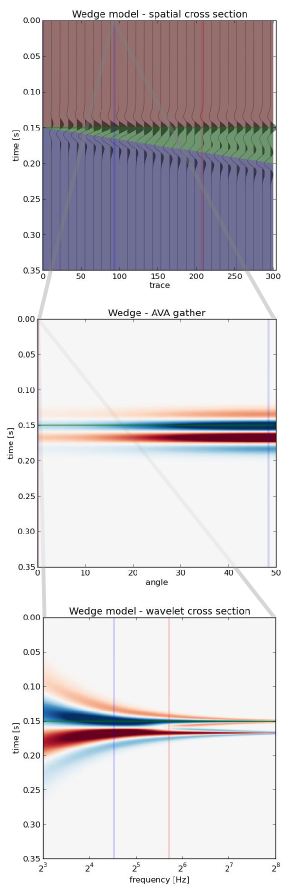
3 ways to slice a wedge

To the uninitiated, the classic 3-layer wedge model may seem ridiculously trivial. Surely the earth looks more complicated than that! But we can leverage such geometric simplicity to systematically study how seismic waveforms change across spatial and non-spatial dimensions. 

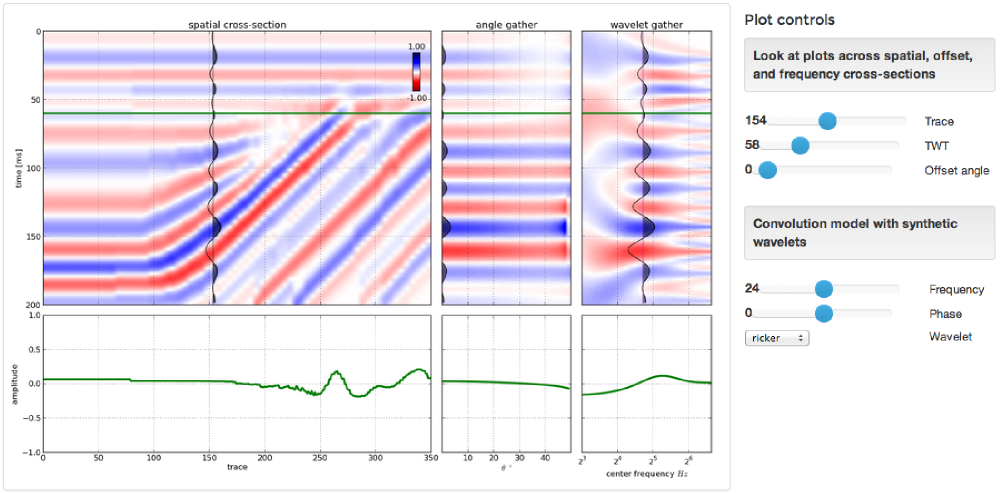
Spatial domain. In cross-section (right), a seismic wedge model lets you analyse the resolving power of a given wavelet. In this display the onset of tuning is marked by the vertical red line, and the thickness at which maximum tuning occurs is shown in blue. Reflection profiles can be shown for any incidence angle, or range of incidence angles (offset stack).

Amplitude versus angle (AVA) domain. Maybe you are working on a seismic inversion problem so you might want to see what a CDP angle gather looks like above and below tuning thickness. Will a tuned AVA response change your quantitative analysis? This 3-layer model looks like a two-layer AVA gather except our original wavelet looks like it has undergone a 90 degree phase rotation. Looks can be deceiving. 

Amplitude versus frequency domain. If you are trying to design a seismic source for your next survey, and you want to ensure you've got sufficient bandwidth to resolve a thin bed, you can compute a frequency gather — right, bottom — and explore a swath of wavelets with regard to critical thickness in your prospect. The tuning frequency (blue) and resolving frequency (red) are revealed in this domain as well. 

Wedges are tools for seismic waveform classification. We aren't just interested in digitizing peaks and troughs, but the subtle interplay of amplitude tuning, and apparent phase rotation variations across the range of angles and bandwidths in the seismic experiment. We need to know what we can expect from the data, from our supposed geology. 

In a nutshell, all seismic models are about illustrating the band-limited nature of seismic data on specific geologic scenarios. They help us calibrate our intuition when bandwidth causes ambiguity in interpretation. Which is nearly all of the time.