x lines of Python: read and write a shapefile

Shapefiles are a sort-of-open format for geospatial vector data. They can encode points, lines, and polygons, plus attributes of those objects, optionally bundled into groups. I say 'sort-of-open' because the format is well-known and widely used, but it is maintained and policed, so to speak, by ESRI, the company behind ArcGIS. It's a slightly weird (annoying) format because 'a shapefile' is actually a collection of files, only one of which is the eponymous SHP file. 

Today we're going to read a SHP file, change its Coordinate Reference System (CRS), add a new attribute, and save a new file in two different formats. All in x lines of Python, where x is a small number. To do all this, we need to add a new toolbox to our xlines virtual environment: geopandas, which is a geospatial flavour of the popular data management tool pandas.

Here's the full rundown of the workflow, where each item is a line of Python:

  1. Open the shapefile with fiona (i.e. not using geopandas yet).
  2. Inspect its contents.
  3. Open the shapefile again, this time with geopandas.
  4. Inspect the resulting GeoDataFrame in various ways.
  5. Check the CRS of the data.
  6. Change the CRS of the GeoDataFrame.
  7. Compute a new attribute.
  8. Write the new shapefile.
  9. Write the GeoDataFrame as a GeoJSON file too.

By the way, if you have not come across EPSG codes yet for CRS descriptions, they are the only way to go. This dataset is initially in EPSG 4267 (NAD27 geographic coordinates) but we change it to EPSG 26920 (NAD83 UTM20N projection).

Several bits of our workflow are optional. The core part of the code, items 3, 6, 7, and 8, are just a few lines of Python:

    import geopandas as gpd
    gdf = gpd.read_file('data_in.shp')
    gdf = gdf.to_crs({'init': 'epsg:26920'})
    gdf['seafl_twt'] = 2 * 1000 * gdf.Water_Dept / 1485
    gdf.to_file('data_out.shp')

That's it! 

As in all these posts, you can follow along with the code in the Jupyter Notebook.

Murphy's Law for Excel

Where would scientists and engineers be without Excel? Far, far behind where they are now, I reckon. Whether it's a quick calculation, or making charts for a thesis, or building elaborate numerical models, Microsoft Excel is there for you. And it has been there for 32 years, since Douglas Klunder — now a lawyer at ACLU — gave it to us (well, some of us: the first version was Mac only!).

We can speculate about reasons for its popularity:

  • It's relatively easy to use, and most people started long enough ago that they don't have to think too hard about it.
  • You have access to it, and you know that your collaborators (boss, colleagues, future self) have access to it.
  • It's flexible enough that it can do almost anything.
Figure 1 from 'Predicting bed thickness with cepstral decomposition'.

Figure 1 from 'Predicting bed thickness with cepstral decomposition'.

For instance, all the computation and graphics for my two 2006 articles on signal processing were done in Excel (plus the FFT add-on). I've seen reservoir simulators, complete with elaborate user interfaces, in Excel. An infinity of business-critical documents are stored in Excel (I just filled out a vendor registration form for a gigantic multinational in an Excel spreadsheet). John Nelson at ESRI made a heatmap in Excel. You can even play Pac Man.

Maybe it's gone too far:


So what's wrong with Excel?

Nothing is wrong with it, but it's not the best tool for every number-crunching task. Why?

  • Excel files are just that — files. Sometimes you want to do analysis across datasets, and a pool of data (a database) becomes more useful. And sometimes you wish nine different people didn't have nine different versions of your spreadsheet, each emailing their version to nine other people...
  • The charts are rather clunky and static. They don't do well with large datasets, or in data you'd like to filter or slice dynamically.
  • In large datasets, scrolling around a spreadsheet gets old pretty quickly.
  • The tool is so flexible that people get carried away with pretty tables, annotating their sheets in ways that make the printed page look nice, but analysis impossible.

What are the alternatives?

Excel is a wonder-tool, but it's not the only tool. There are alternatives, and you should at least know about them.

For everyday spreadsheeting needs, I now use Google Sheets. Collaboration is built-in. Being able to view and edit a sheet at the same time as someone else is a must-have (probably Office 365 does this now too, so if you're stuck with Excel I urge you to check). Version control — another thing I'm not sure I can live without — is built in. For real nerds, there's even a complete API. I also really like the native 'webbiness' of Google Docs, for example being able to use web API calls natively, for example getting the current CAD–USD exchange rate with GoogleFinance("CURRENCY:CADUSD").

If it's graphical analysis you want, try Tableau or Spotfire. I'm especially looking at you, reservoir engineers — you are seriously missing out if you're stuck in Excel, especially if you have a lot of columns of different types (time series, categories and continuous variables for example). The good news is that the fastest way to get data into Spotfire is... Excel. So it's easy to get started.

If you're gathering information from people, like registering the financial details of vendors for instance, then a web form is your best bet. You can set one up in Google Forms in minutes, and there are lots of similar services. If you want to use your own servers, no problem: any dev worth their wages can throw one together in a few hours.

If you're doing geoscience in Excel, like my 2006 self — filtering logs, or generating synthetics, or computing spectrums — your mind will be blown by spending a few hours learning a programming language. Your first day in Python (or Julia or Octave or R) will change your quantitative life forever.

Excel is great at some things, but for most things, there's a better way. Take some time to explore them the next time you have some slack in your schedule.

References

Hall, M (2006). Resolution and uncertainty in spectral decomposition. First Break 24, December 2006, p 43–47.

Hall, M (2006). Predicting stratigraphy with cepstral decomposition. The Leading Edge 25 (2, Special Issue on Spectral Decomposition). doi:10.1190/1.2172313


UPDATE

As a follow-up example, I couldn't resist sharing this recent story about an artist that draws anime characters in Excel.

Newsflash: the Geophysics Hackathon is back!

Mark your calendar: 22–24 September (right before SEG), at a downtown Houston location to be confirmed.

We're filling the room with 50 geoscientists of all stripes. Interpreters, programmers, students, professionals... everyone is welcome. The plan: to imagine, design, and prototype some new tools in geophysics — all around the theme of machine learning. It's going to be awesome. 

The schedule: we'll get started at 6 pm on Friday 22 September, and go till 10 pm. Then we pick it up again on Saturday morning, and go till 6 pm, and the same again on Sunday. Teams will present a demo to everyone on Sunday after 3 pm. There will be a few prizes, a few drinks, lots of food, and a lot of new geophysical tools and widgets. 

If you want to know more about what a hackathon is, read my summary from the last one: Le grand hack! Or check out the project round-up posts, part 1 and part 2.

If you're not sure you belong, I promise that you do. One of the prize-winning teams in Paris had no coding experience! And every team needs help with brainstorming, design, testing, and presentation. Absolutely anyone can contribute, and absolutely everyone will learn something.

If you have some like-minded friends, bring them along! We need teams of 5 people, so if there are already 5 of you, you can start coding as soon as you walk in the door!

If you can't be there yourself, please share this post with someone you know.

When you're ready, click here to buy a ticket.


Thank you as always to our sponsors so far: Dell EMC and Amazon AWS. If you'd like to sponsor the Houston event, please check this page out, or just get in touch.

Another fossil book

I'm thrilled to introduce the latest book in the 52 Things series!

52 More Things You Should Know About Palaeontology is out. You can buy it direct from us, on Amazon.com and Amazon.co.uk, and it will soon be available all over the world via Amazon's other stores.

In common with all the books from Agile Libre, it is a scholarly text with some weird features. For example:

  • It's fun and easy to read. Each of the 52 essays is only about 700 words long.
  • It costs $19, not $49 (I am not making that $49 up. Welcome to academic publishing!)
  • It's openly licensed, so you can re-use any of the content with attribution but without permission.
  • $2 from every sale goes to the Society of Vertebrate Paleontology to support their work.

A book for everyone

Like the first 52 Things on fossils, it's not just for palaeontologists. No matter who you are, I hereby guarantee that you'll find something useful and interesting in there, or your money back. I mean, just look at some of these chapters:

  • A closer look at fossil sex, by Benni Bomfleur & Hans Kerp — in flagrante!
  • A snake with four legs, by David Martill — chronic limb loss!
  • Birds of a fibula, by Jon Tennant — dino bones!
  • Fossils for sale, by Tony Doré, OBE, of Statoil — selling shells!
  • Gods and monsters, by Andrew Taylor — miracles!
  • How kangaroos got their bounce, by Benjamin P Kear — just so!
  • Impossible frogs in the Deccan Traps, by Michael Oates — igneous fossils!
  • In search of the Balearian mouse goat, by Alun Williams — mouse goats!
  • Interview with a Triceratops, by John Scanella — dinosaurs forever!
  • Micro-dung and its uses, by Wyn Hughes — tiny poo!
  • Traces in the terrarium, by Daniel Hembree — experimental ichnology!
  • Vertebrate palaeontology: more than fossil bones, by John Hutchinson — see dino run!

A huge thanks to the 50(!) authors of this volume. Together, I estimate they have over 1000 years of experience to share. Imagine that for a moment. All that learning, centuries in the field, decades in the library, or squinting down microscopes... just to write an essay for you! 

Massive thanks as well to Alex Cullum and Allard Martinius, both of Statoil. It takes a good deal of tenacity to rally 50 people to do anything, let alone write a book together... and they've done it twice. And they've nailed it again — check out what Prof David Polly (Indiana), president of the Society of Vertebrate Palaeontology had to say about the book:

[It] looks fantastic. There is a lot of useful and high-level information in it, plus it is entertaining to read. I’m also pleased to see several SVP members in the author list. It deserves to be a great success. (The other books in the series are equally wonderful... having worked with eigenvectors daily for decades, I nevertheless learned something from Ruelicke’s chapter in the Geology volume.)

I hope you enjoy the book too!


Have you read 52 Things... Rock Physics? If you enjoyed it, or even if you didn't, we'd love a short review on Amazon.com :) Help spread some geophysics goodness.

Fear and loathing in oil & gas

Sometimes you have to swallow your fear. This is one of those times.

The proliferation of 3D seismic in the 1980s was a major step forward for the petroleum industry. However, it took more than a decade for the 3D seismic method to become popular. During that decade, seismic equipment continued to evolve, particularly with the advent of telemetry recording systems that needed for doing 3D surveys offshore.

Things were never the same again. New businesses sprouted up to support it, and established service companies and tech companies exploded size and in order to keep up with the demand and all the new work.

Not so coincidently, another major shift happened in the late 1980s and early 1990s with the industry-wide shift to Sun workstations in order to cope with the crunching and rendering the overwhelming influx of all these digits. UNIX workstations with hilariously large cathode-ray tube monitors became commonplace. This industry helped make Sun and many other IT companies very wealthy, and once again everything was good. At least until Sun's picnic was trampled on by Linux workstations in the early 2000s, but that's another story...

I think the advent of 3D seismic is one of many examples of the upstream oil and gas industry thriving on technological change. 3D seismic changed everything, facilitating progress in the full sense of the word and we never looked back. As an early career geoscientist, I don't know what the world was like before 3D seismic, but I have interpreted 2D data and I know it's an awful experience — even on a computer.

Debilitating skepticism?

Today, in 2017, we find ourselves in the middle of the next major transformation. Like 3D seismic before it, machine learning will alter yesterday's landscape beyond all recognition. We've been through all of this before, but this time, for some reason it feels different. Many people are cautious, unconvinced about whether this next thing will live up to the hype. Other people are vibrating with excitement viewing the whole thing with rose-coloured glasses. Still others truly believe that it will fail — assertively rejecting hopes and over-excited claims that yes, artificial intelligence will catapult us into a better world, a world beyond our wildest dreams.

A little skepticism is healthy, but I meet a lot of people who are so skeptical about this next period of change that they are ignoring it. It feels to me like an unfair level of dismissal, a too-rigid stance. And it has left me rather perplexed: Why is there so much resistance and denial this time around? Why the apprehension?

I'll wager the reason it is different this time because this change is happening to us, in spite of us, whether we like it or not. We're not in the driving seat. Most of us aren't even in the passenger seat. Unlike seismic technology and UNIX|Linux workstations, our sector has had little to do with this revolution. We haven't been pushing for it, instead, it is dragging us along with it. Worse, it's happening fast; even the people who are trying to keep up with it can barely hold on. 

We need you

This is the opportunity of a lifetime. It's happening. High time to crank up the excitement, get involved, be a part of it. I for one want you to be part of it. Come along with us. We need you, whether you like it or not. 


This post was provoked by a conversation on LinkedIn.

Subsurface Hackathon project round-up, part 2

Following on from Part 1 yesterday, here are the other seven team projects from the hackathon:


Interactive visualization of Water Table heights over many years.

Interactive visualization of Water Table heights over many years.

Water, water everywhere

Water Underground: Martin Bentley (NMMU), Joseph Barraud (Rolls Royce), Rabah Cheknoun (UPPA)

The team built readers for the groundwater data available from dinoloket.nl, both the groundwater levels and the hydrochemistry. They clustered the data by aggregating by month and then looking for similarities in levels in the boreholes and built an open Jupyter notebook.


Seismic from noise

OBSNoise: Fernando Villanueva-Robles (IPGP), Yann Huet (Setec-Lerm), Ngoc Huyen Luu (Ecole Polytechnique), Dorian Bagur (Telecom ParisTech), Jonathan Grandjean (Independent)

The OBSNoise project investigated the application of machine learning to coherently stack ambient noise records collected from ocean bottom seismic (OBS) arrays in order to extract reservoir information. The team's results from synthetic data showed promise. If fully developed, this technology could be a virtually real-time monitoring system of dynamic reservoir properties.


The Killers. Killing It. 

The Killers. Killing It. 

Global geochemical data analytics

The Killers: Alexandre Sache, Violaine Delahaye, Karl Sache (all from Institute Polytechnique UniLaSalle), Côme Arvis, Guillaume Ligner (Ecole Polytechnique)

Two geoscience undergrads and one automotive design student (I know right?) from UniLaSalle hooked up with two data science students from Ecole Polytechnique to interogate the massive GeoRoc database using some clever data analytics tricks and did some novel many-dimensional geochemical classifications.


Team LogFix.

Team LogFix.

Fixing broken well data

LogFix: Guillaume Coffin (Telecom Evolution), Florian Napierala (EISTI), Camille Gimenez (Université Paris-Saclay), Tristan Siméon (Université de Montpellier), Robert Leckenby (Independent)

A truly pristine, calibrated, and corrected petrophysical data is so rare it has a sort of mythical status. Team LogFix used machine learning to identify bad-data zones, repair, QC, and fill-in missing sections. They got an impressive way with the problem, using a dataset from the Athabasca of Canada.


Between the hand-drawn lines

Automagical: Louis Poirier (Independent), Maggie Baber (Independent), Georg Semmler (GiGa infosystems), Björn Wieczoreck (GiGa infosystems), Jonas Kopcsek (GiGa infosystems)

Automagical_Paris_Hackathon.png

You don't need to believe in magic. Team Automagical used machine learning to create 3D geological models from 2D cross-sections sections. They trained a predictive model using a collection of standardized hand-drawn cross-sections from human geoscientists. The model learns how to propagate rocks throughout a 3D scene. Their goal is to be able to generate cross-sections along any direction through the model. The AI learned how to do geologically realistic interpolation on simple structures. What kind of geologic complexity is possible with more input from more cross-sections?


The document on the left contains a log display with a lithology column. It's a 'hit'. The one on the right has no lithlogies and is a 'miss'. 

The document on the left contains a log display with a lithology column. It's a 'hit'. The one on the right has no lithlogies and is a 'miss'.


There's rocks in them hills! Hills of paper, that is

Logs on the Rocks: Daniel Stanton (Leeds University), Jack Woolam (Leeds University), Adam Goddard (Leeds University), Henri Blondelle (AgileDD)

If the oil and gas industry is to get more efficient, we better get really good at finding lithology and fluid information in the mountains of paper we've collectively built. Team Logs on the Rocks used CNNs to identify graphical depictions of rock types in a sea of unstructured PDFs and TIFFs. They introduced themselves as a team of non-coders, but these guys were were doing cloud computing on AWS and using NVIDIA's GPUs before the end of the weekend. 


Robot vision for seismic interpretation

It's not our FAULT! Claire Birnie (Leeds University), Carlos Alberto da Costa Filho (Edinburgh University), Matteo Ravasi (Statoil), Filippo Broggini (ETHZ), Gijs Straathof (SGS)

Geologic feature recognition using machine learning. The goal was to assist seismic interpreters in detecting geologic features – faults, folds, traps, etc. – in seismic data . They used Haar cascade classifiers, which are routinely used for identifying faces or kittens or beer bottles in photographs and video streams, specially trained to work on seismic data. They used the awesome OpenCV library to build this technology. At the time of writing, their website appears to be maxed out for the month, so if you're dying to see it, leave them a comment on LinkedIn asking them increase their capacity. And in the meantime, you can check out their project's repo on GitHub.

Kudos for the open source repo, team!


It was thrilling to see such a large range of data and applications. Digital thin-sections, ground water maps, seismic data, well logs, cross-sections, information in unstructured documents, and so on. Thanks to each and every individual that showed up with their expertise and enthusiasm. We're all better off because of it.

A quick reminder that our sponsors are awesome! Please high-five them next time you meet them...

Subsurface Hackathon project round-up, part 1

The dust has settled from the Hackathon in Paris two weeks ago. Been there, done that, came home with the T-shirt.

In the same random order they presented their 4-minute demos to our panel of esteemed judges, I present a (very) abbreviated round-up of what the teams made together over the course of the weekend. With the exception of a few teams who managed to spontaneously nucleate before the hackathon, most of these teams were comprised of people who had never met each other before the event.

Just let that sink in for a second: teams of mostly mutual strangers built 13 legit machine-learning-based geoscience applications in one weekend. 


Log Healer  

Log Healer


An automated well log management system

Team Un-well Loggers: James Wanstall (Glencore), Niket Doshi (Teradata), Joseph Taylor (Teradata), Duncan Irving (Teradata), Jane McConnell (Teradata).

Tech: Kylo (NiFi, HDFS, Hive, Spark)

If you're working with well logs, and if you've got lots of them, you've almost certainly got gaps or inaccuracies from curve to curve and from well to well. The team's scalable, automated well-log file management system Log Healer computes missing logs and heals broken ones. Amazing.


An early result from Team Janus. The image on the left is ground truth, that on the right is predicted. Many of the features are present. Not bad for v0.1!

An early result from Team Janus. The image on the left is ground truth, that on the right is predicted. Many of the features are present. Not bad for v0.1!

Meaningful cross sections from well logs

Team Janus: Daniel Buse, Johannes Camin, Paul Gabriel, Powei Huang, Fabian Kampe (all from GiGa Infosystems)

The team built an elegant machine learning workflow to attack the very hard problem of creating geologically realistic cross-section from well logs. The validation algorithm compares pixels to score the result. 


Think Section's mindblowing photomicrograph labeling tool can also make novel camouflage patterns.

Think Section's mindblowing photomicrograph labeling tool can also make novel camouflage patterns.

Paint-by-numbers on digital thin sections

Team Think Section: Diego Castaneda (Agile*), Brendon Hall (Enthought), Roeland Nieboer (Fugro), Jan Niederau (RWTH Aachen), Simon Virgo (RWTH Aachen)

Tech: Python (Scikit Learn, Scikit Image, Flask, NumPy, SciPy, Pandas), AWS for hosting app & Jupyter server.

Description: Mineral classification and point-counting on thin sections can be an incredibly tedious and time consuming task. Team Think Section trained a model to segregate, classify, and label mineral grains in 200GB of high-resolution multi-polarization-angle photomicrographs.


Team Classy's super-impressive shot gather seismic event Detection technology. Left: synthetic gather. Middle: predicted labels. Right: truth.

Team Classy's super-impressive shot gather seismic event Detection technology. Left: synthetic gather. Middle: predicted labels. Right: truth.

Event detection on seismic shot gathers

Team Classy: Princy Ikotoko Ndong (EOST), Anna Lim (NTNU), Yuriy Ivanov (NTNU), Song Hou (CGG), Justin Gosses (Valador).

Tech: Python (NumPy, Matplotlib), Jupyter notebooks.

The team created an AI which identifies and labels different events on a shot gather image. It can find direct waves, reflections, multiples or coherent noise. It uses a support vector machine for classification, and is simple and fast. 


model2seismic: An entirely new way to do modeling and inversion. Take note: the neural network that made this image knows no physics.

model2seismic: An entirely new way to do modeling and inversion. Take note: the neural network that made this image knows no physics.

Forward and inverse modeling without the physics

Team GANsters - Lukas Mosser (Imperial), Wouter Kimman (Meridian), Jesper Dramsch (Copenhagen), Alfredo de la Fuente (Wolfram), Steve Purves (Euclidity)

Tech: PyNoddy, homegrown Python ML tools.

The GANsters created a deep-learning image-translation-based seismic inversion and forward modelling system. I urge you to go and look at their project on model2seismic. If it doesn't give you goosebumps, you are geophysically inert.


Team Pick Pick Log

Team Pick Pick Log

Machine learning for for stratigraphic interpretation

Team Pick Pick LOG - Antoine Vanbesien (EOST), Fidèle Degni (Mines St-Étienne), Massinissa Mesbahi (Pau), Natsuki Gunji (Mines St-Étienne), Cédric Menut (EOST).

This team of data science and geoscience undergrads attacked an automated stratigraphic interpretation task. They used supervised learning to determine lithology from well logs in Alberta's Athabasca play, then attempted to teach their AI to pick stratigraphic tops. Impressive!


Pretty amazing, huh? The power of the hackathon to bring a project from barely-even-an-idea to actual-working-code is remarkable! And we're not even halfway through the teams: tomorrow I'll describe the other seven projects. 

Machine learning meets seismic interpretation

Agile has been reverberating inside the machine learning echo chamber this past week at EAGE. The hackathon's theme was machine learning, Monday's workshop was all about machine learning. And Matt was also supposed to be co-chairing the session on Applications of machine learning for seismic interpretation with Victor Aare of Schlumberger, but thanks to a power-cut and subsequent rescheduling, he found himself double-booked so, lucky me, he invited me to sit in his stead. Here are my highlights, from the best seat in the house.

Before I begin, I must mention the ambivalence I feel towards the fact that 5 of the 7 talks featured the open-access F3 dataset. A round of applause is certainly due to dGB Earth Sciences for their long time stewardship of open data. On the other hand, in the sardonic words of my co-chair Victor Aarre, it would have been quite valid if the session was renamed The F3 machine learning session. Is it really the only quality attribute research dataset our industry can muster? Let's do better.

Using seismic texture attributes for salt classification

Ghassan AlRegib ruled the stage throughout the session with not one, not two, but three great talks on behalf of himself and his grad students at Georgia Institute of Technology (rather than being a show of bravado, this was a result of problems with visas). He showed some exciting developments in shallow learning methods for predicting facies in seismic data. In addition to GLCM attributes, he also introduced a couple of new (to me anyway) attributes for salt classification. Namely, textural gradient and a thing he called seismic saliency, a metric modeled after the human visual system describing the 'reaction' between relative objects in a 3D scene. 

Twelve Seismic attributes used for multi-attribute salt-boundary classification. (a) is RMS Amplitude, (B) to (M) are TEXTURAL attributes. See abstract for details. This figure is copyright of Ghassan AlRegib and licensed CC-BY-SA by virtue of being generated from the F3 dataset of dGB and TNO.

Ghassan also won the speakers' lottery, in a way. Due to the previous day's power outage and subsequent reshuffle, the next speaker in the schedule was a no-show. As a result, Ghassan had an extra 20 minutes to answer questions. Now for most speakers that would be a public-speaking nightmare, but Ghassan hosted the onslaught of inquiring minds beautifully. If we hadn't had to move on to the next next talk, I'm sure he could have entertained questions all afternoon. I find it fascinating how unpredictable events like power outages can actually create the conditions for really effective engagement. 

Salt classification without using attributes (using deep learning)

Matt reported on Anders Waldeland's work a year ago, and it was interesting to see how his research has progressed, as he nears the completion of his thesis. 

Anders successfully demonstrated how convolutional neural networks (CNNs) can classify salt bodies in seismic datasets. So, is this a big deal? I think it is. Indeed, Anders's work seems like a breakthough in seismic interpretation, at least of salt bodies. To be clear, I don't think this means that it is time for seismic interpreters to pack up and go home. But maybe we can start looking forward to spending our time doing less tedious things than picking complex salt bodies.  

One slice of a 3d seismic volume with two CLASS LABELS: Salt (red) and Not SALT (GREEN). This is the training data. On the right: Extracted 3D salt body in the same dataset, coloured by elevation. Copyright of A Waldeland, used with permission.

One slice of a 3d seismic volume with two CLASS LABELS: Salt (red) and Not SALT (GREEN). This is the training data. On the right: Extracted 3D salt body in the same dataset, coloured by elevation. Copyright of A Waldeland, used with permission.

He trained a CNN on one manually labeled slice of a 3D cube and used the network to automatically classify the full 3D salt body (on the right in the figure). Conventional algorithms for salt picking, such as that used by AlRegib (see above), typically rely on seismic attributes to define a feature space. This requires professional insight and judgment, and is prone to error and bias. Nicolas Audebert mentioned the same shortcoming in his talk in the workshop Matt wrote about last week. In contrast, the CNN algorithm works directly on the seismic data, learning the most discriminative filters on its own, no attributes needed

Intuition training

Machine learning isn't just useful for computing in the inverse direction such as with inversion, seismic interpretation, and so on. Johannes Amtmann showed us how machine learning can be useful for ranking the performance of different clustering methods using forward models. It was exciting to see: we need to get back into the habit of forward modeling, each and every one of us. Interpreters build synthetics to hone their seismic intuition. It's time to get insanely good at building forward models for machines, to help them hone theirs. 

There were so many fascinating problems being worked on in this session. It was one of the best half-day sessions of technical content I've ever witnessed at a subsurface conference. Thanks and well done to everyone who presented.


Machine learning and analytics in geoscience

We're at EAGE in Paris. I'm sitting in a corner of the exhibition because the power is out in the main hall, so all the talks for the afternoon have been postponed. The poor EAGE team must be beside themselves, I feel for them. (Note to future event organizers: white boards!)

Yesterday Diego, Evan, and I — along with lots of hackathon participants — were at the Data Science for Geosciences workshop, an all-day machine learning fest. The session was chaired by Cyril Agut (Total), Marianne Cuif-Sjostrand (Total), Florence Delprat-Jannaud (IFPEN), and Noalwenn Dubos-Sallée (IFPEN), and they had assembled a good programme, with quite a bit of variety.

Michel Lutz, Group Data Officer at Total, and adjunct at École des Mines de Saint-Étienne, gave a talk entitled, Data science & application to geosciences: an introduction. It was high-level but thoughtful, and such glimpses into large companies are always interesting. The company seems to have a mature data science strategy, and a well-developed technology stack. Henri Blondelle (AgileDD) asked about open data at the end, and Michel somewhat sidestepped on specifics, but at least conceded that the company could do more in open source code, if not data.

Infrastructure, big data, and IoT

Next we heard a set of talks about the infrastructure aspect of big (really big) data.

Alan Smith of Luchelan told the group about some negative experiences with Hadoop and seismic data (though it didn't seem to me that his problems were insoluble since I know of several projects that use it), and the realization that sometimes you just need fast infrastructure and custom software.

Hadi Jamali-Rad of Shell followed with an IoT story from the field. He had deployed a large number of wireless seismic sensors around a village in Holland, then tested various aspects of the communication system to answer questions like, what's the packet loss rate when you collect data from the nodes? What about from a balloon stationed over the site?

Duncan Irving of Teradata asked, Why aren't we [in geoscience] doing live analytics on 100PB of live data like eBay? His hypothesis is that IT organizations in oil and gas failed to keep up with key developments in data analytics, so now there's a crisis of sorts and we need to change how we handle our processes and culture around big data. 

Machine learning

We shifted gears a bit after lunch. I started with a characteristically meta talk about how I think our community can help ensure that our research and practice in this domain leads to good places as soon as possible. I'll record it and post it soon.

Nicolas Audebert of ONERA/IRISA presented a nice application of a 3D convolutional neural network (CNN) to the segmentation and classification of hyperspectral aerial photography. His images have between about 100 and 400 channels, and he finds that CNNs reduce error rates by up to about 50% (compared to an SVM) on noisy or complex images. 

Henri Blondelle of Agile Data Decisions talked about his experience of the CDA's unstructured data challenge of 2016. About 80% of the dataset is unstructured (e.g. folders of PDFs and TIFFs), and Henri's vision is to transform 80% of that into structured data, using tools like AgileDD's IQC to do OCR and heuristic labeling. 

Irina Emelyanova of CSIRO provided another case study: unsupervised e-facies prediction using various types of clustering, from K-means to some interesting variants of self-organizing maps. It was refreshing to see someone revealing a lot of the details of their implementation.

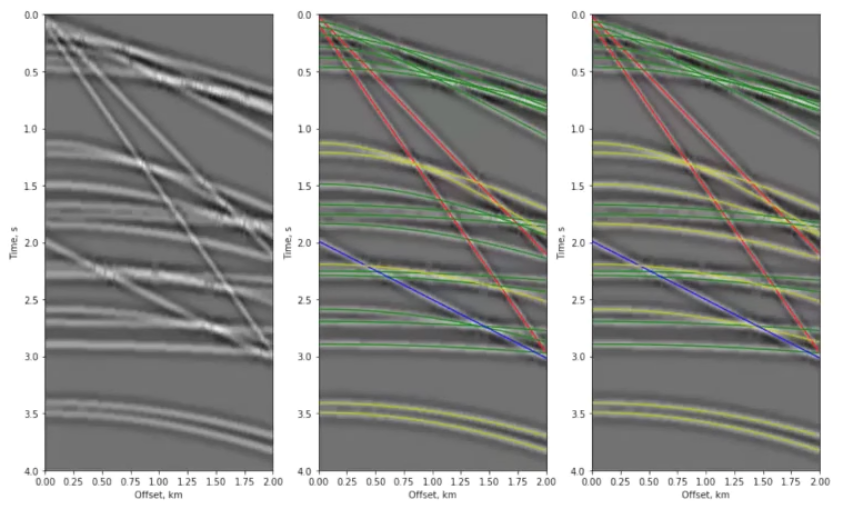
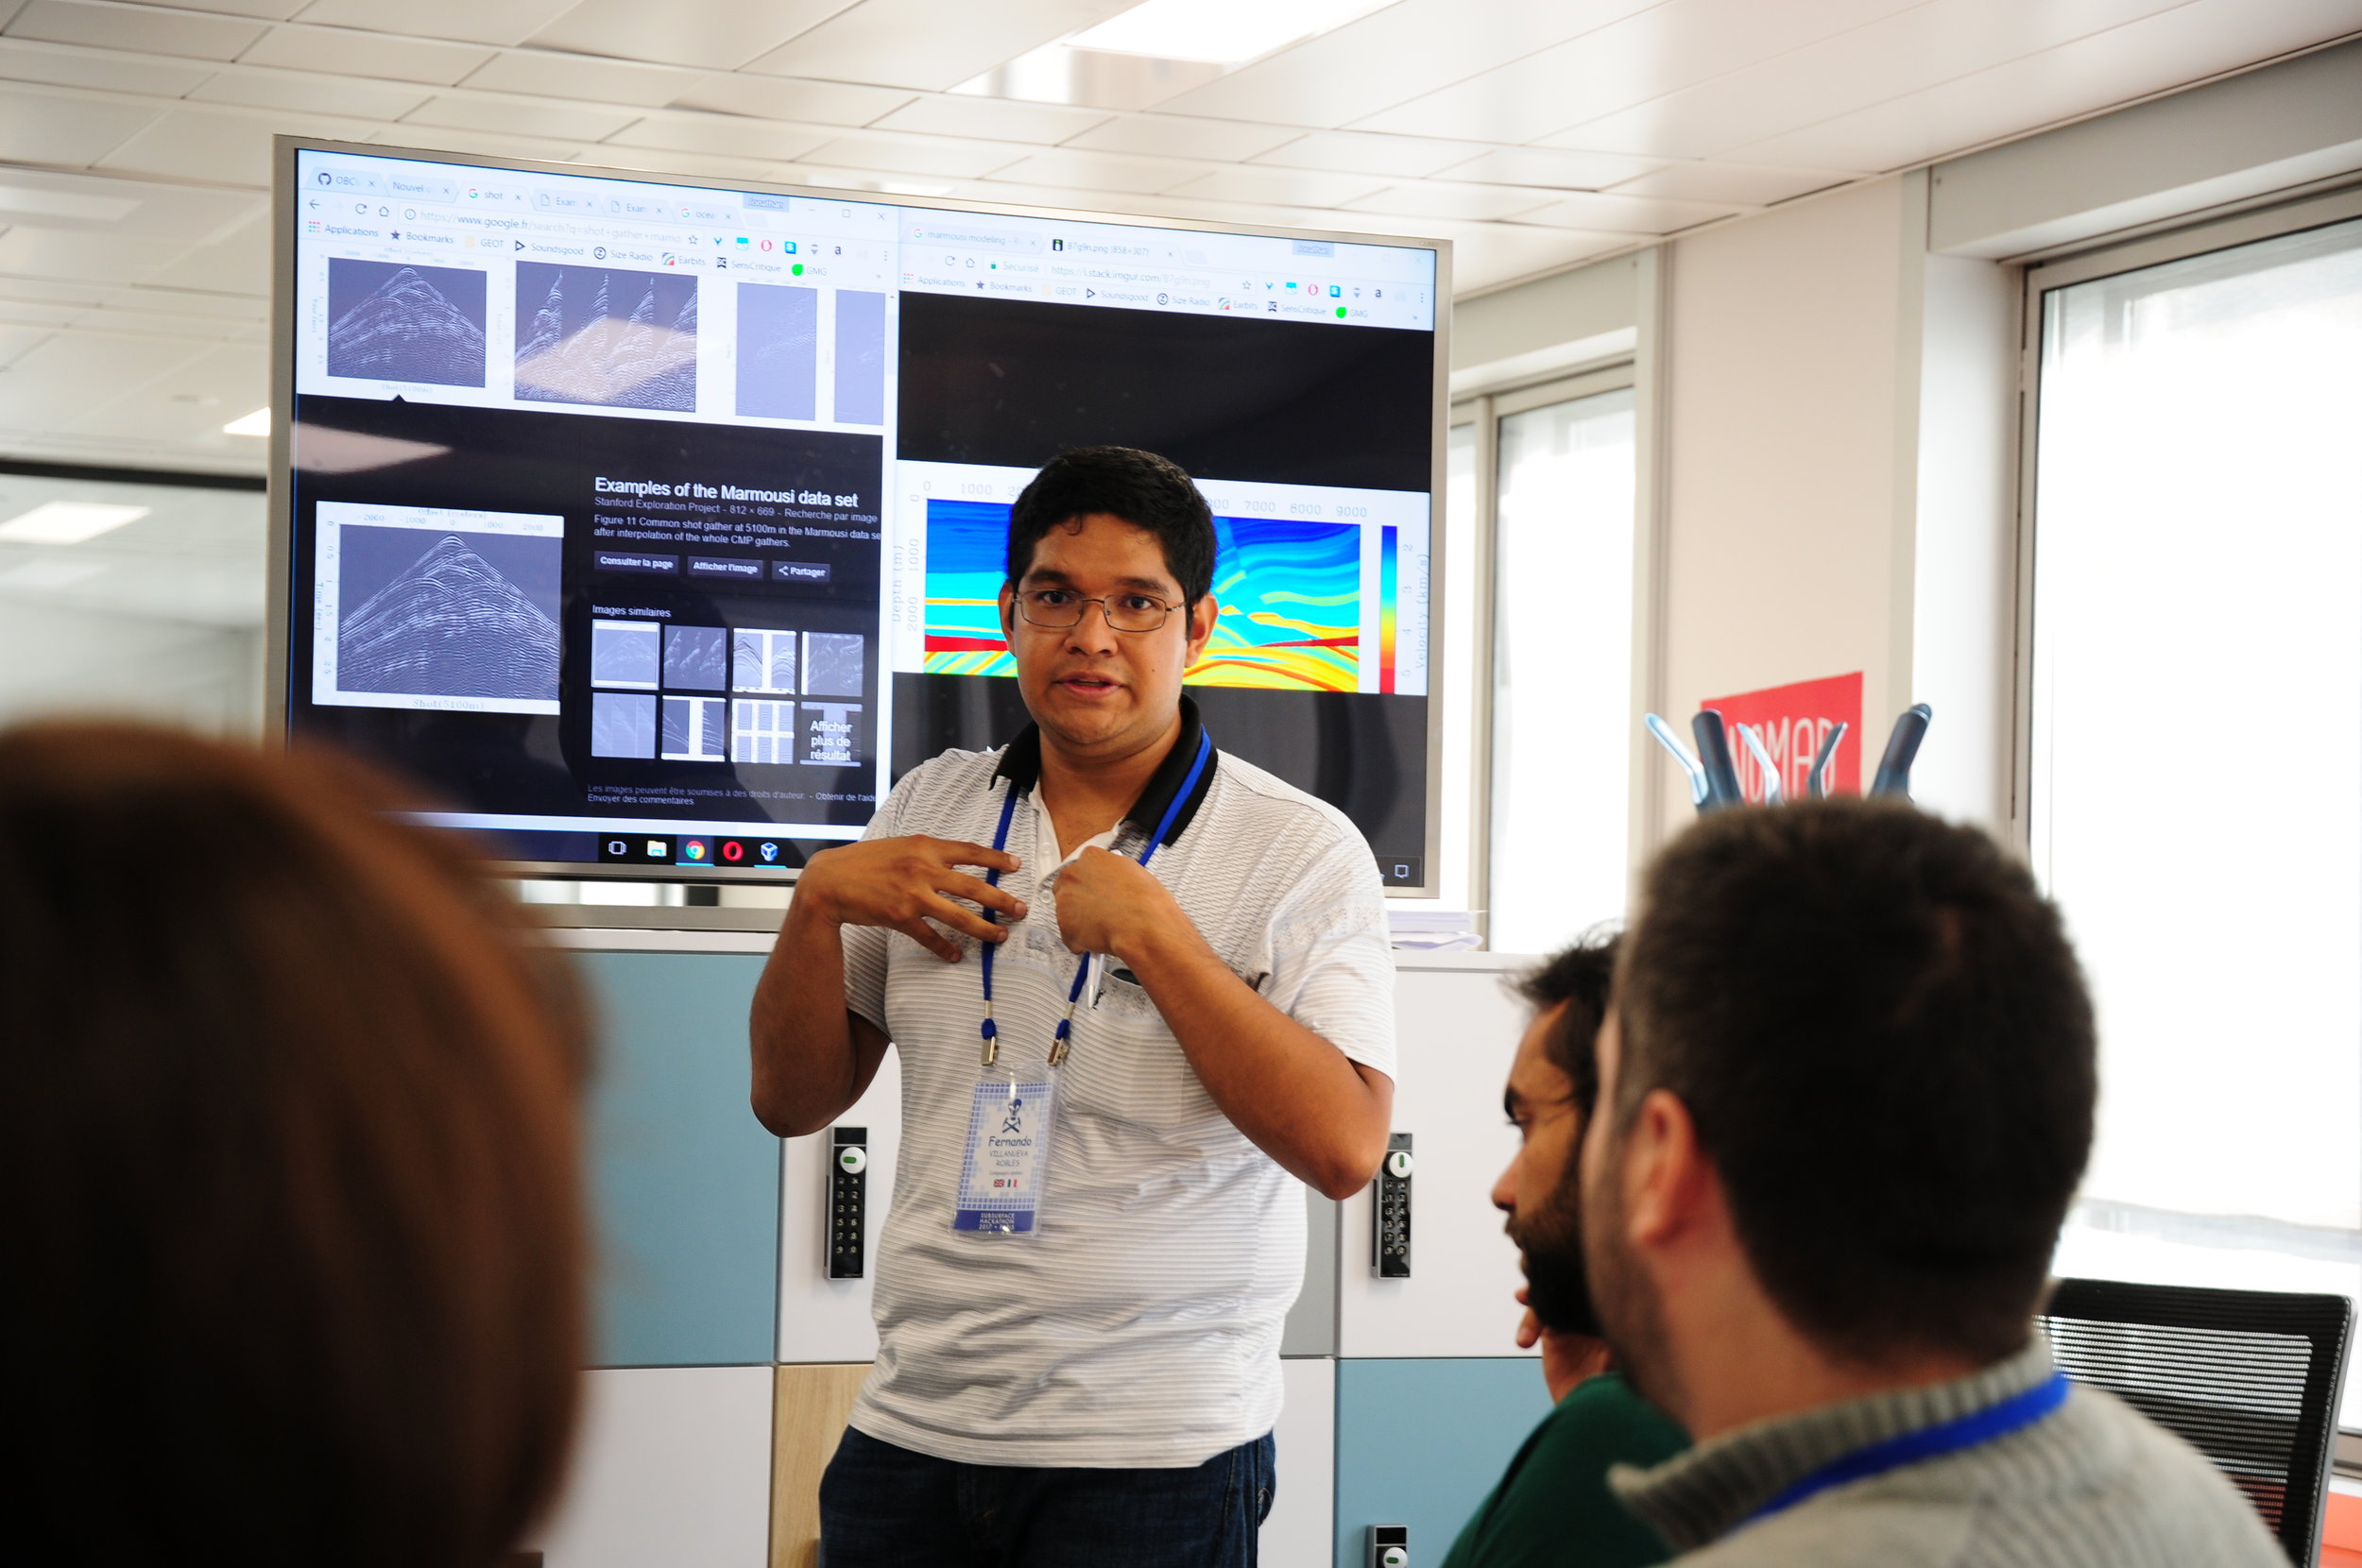
Jan Limbeck, a research scientist at Shell wrapped up the session with an overview of Shell's activities around big data and machine learning, as they prepare for exabytes. He mentioned the Mauricio Araya-Polo et al. paper on deep learning in seismic shot gathers in the special March issue of The Leading Edge — clearly it's easiest to talk about things they've already published. He also listed a lot of Shell's machine learning projects (frac optimization, knowledge graphs, reservoir simulation, etc), but there's no way to know what state they are in or what their chances of success are. 

As well as all the 9 talks, there were 13 posters, about a third of which were on infrastructure stuff, with the rest providing more case studies. Unfortunately, I didn't get the chance to look at them in any detail, but I appreciated the organizers making time for discussion around the posters. If they'd also allowed more physical space for the discussion it could have been awesome.

Analytics!

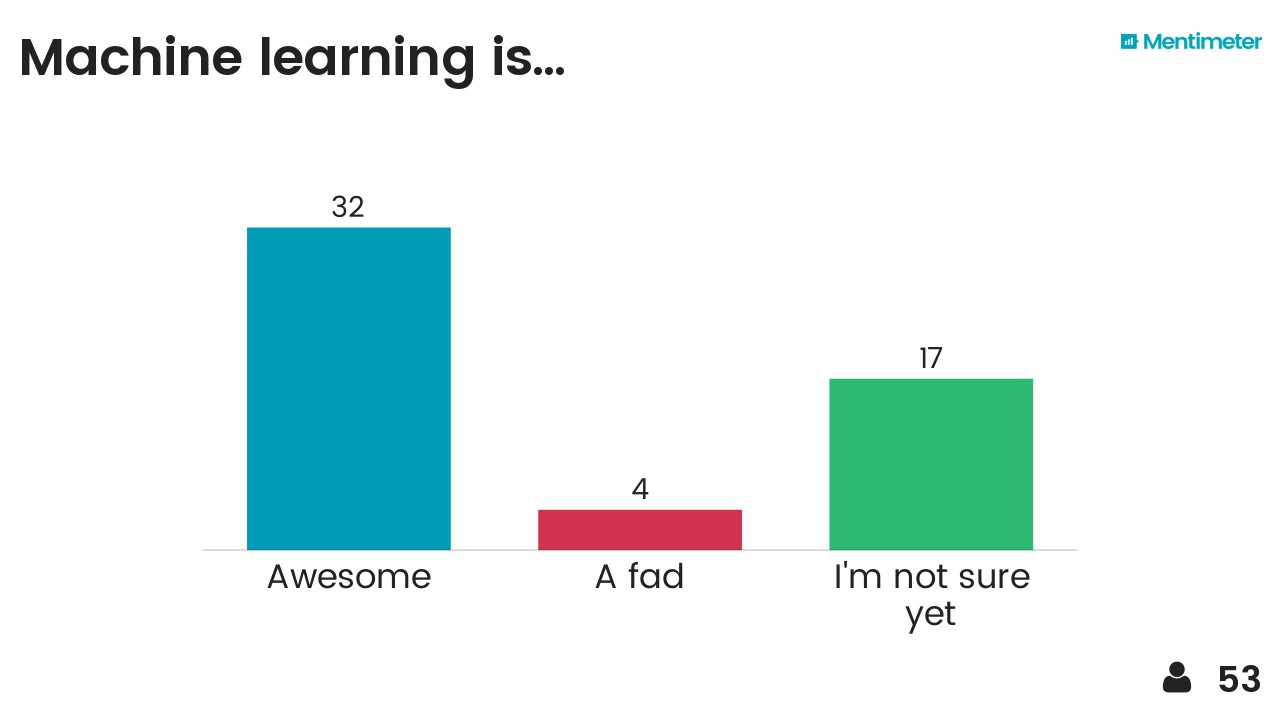
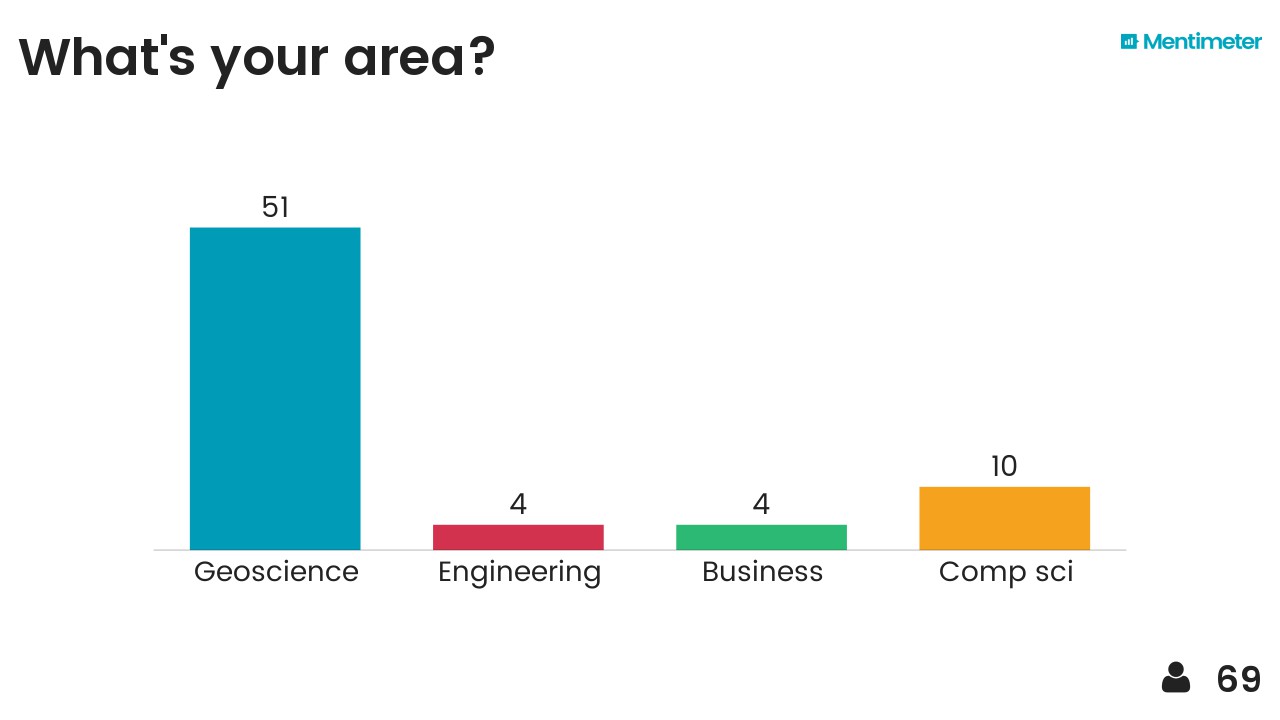
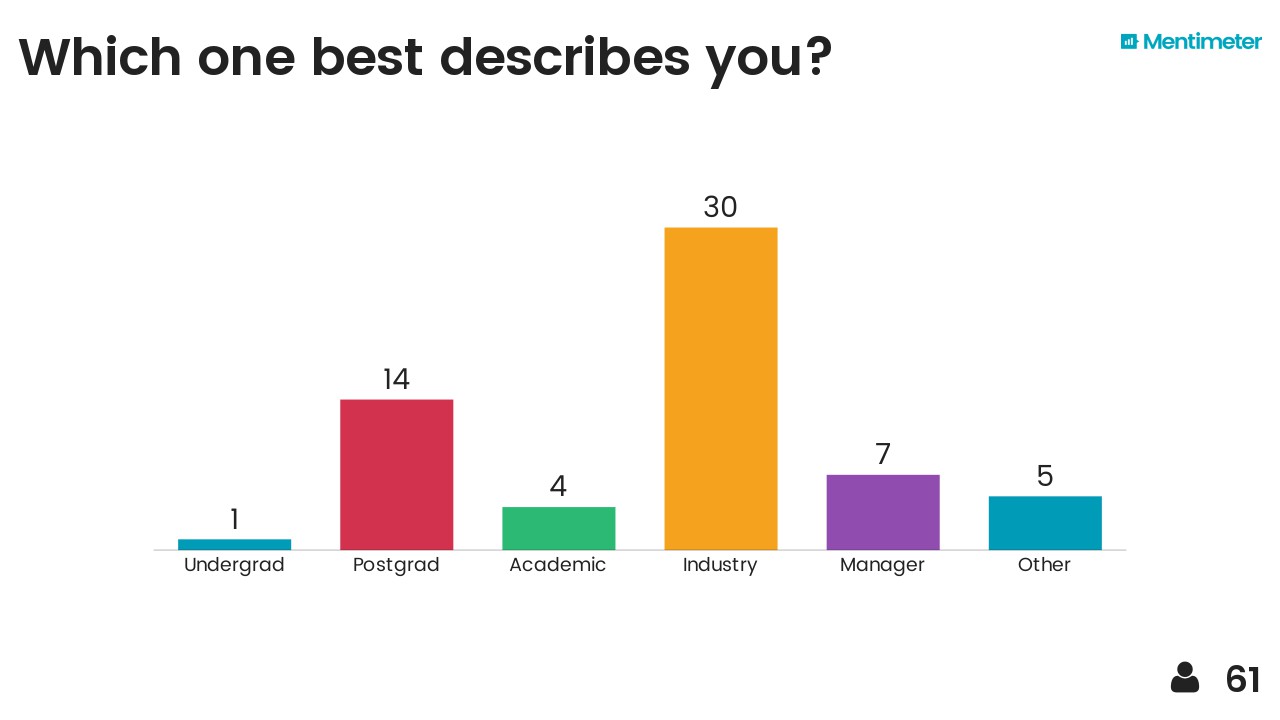
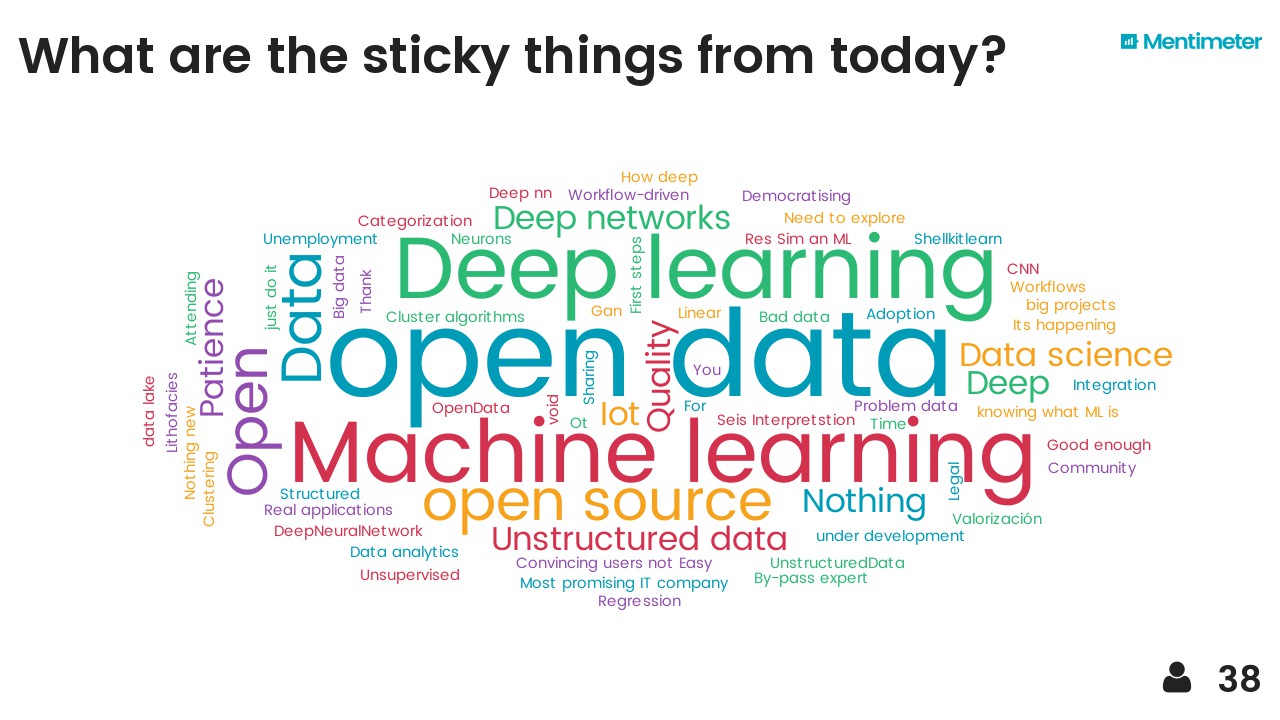
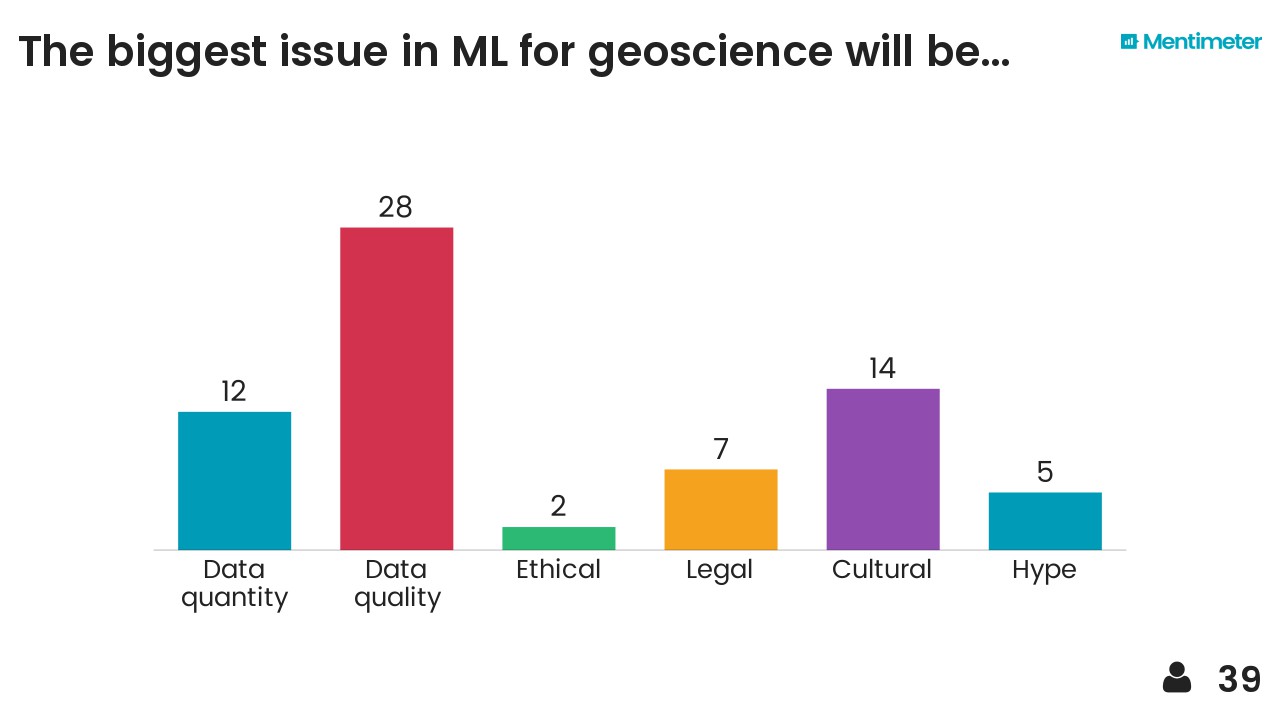
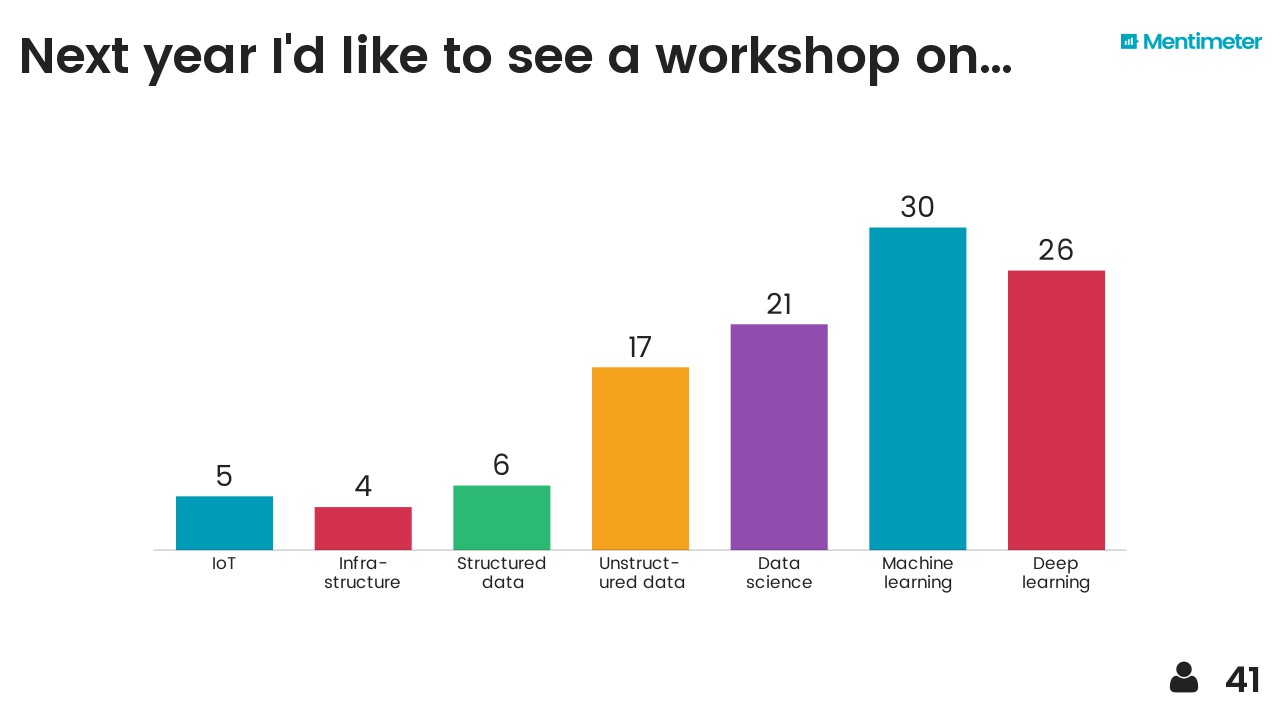
After hearing about Mentimeter from Chris Jackson I took the opportunity to try it out on the audience. Here are the results, I think they are fairly self-explanatory... 

I also threw in the mindmap I drew at the end as a sort of summary. The vertical axis represents something like'abstraction' or 'time' (in a workflow sense) and I think each layer depends somewhat on those beneath it. It probably makes sense to no-one but me.

Breakout!

It seems clear that 2017 is the breakout year for machine learning in petroleum geoscience, and in petroleum in general. If your company or institution has not yet gone beyond "watching" or "thinking about" data science and machine learning, then it is falling behind by a little more every day, and it has been for at least a year. Now's the time to choose if you want to be part of what happens next, or a victim of it.

Le grand hack!

It happened! The Subsurface Hackathon drew to a magnificent close on Sunday, in an intoxicating cloud of code, creativity, coffee, and collaboration. It will take some beating.

Nine months in gestation, the hackathon was on a scale we have not attempted before. Total E&P joined us as co-organizers and made this new reach possible. They also let us use their amazing Booster — a sort of intrapreneurship centre — which was perfect for the event. Their team (thanks especially to Marine and Caroline!) did an amazing job of hosting, as well as providing several professionals from their subsurface software (thanks Jonathan and Yannick!) and data science teams (thanks Victor and David!). Arnaud Rodde and Frédéric Broust, who had to do some organization hacking of their own to make something as weird as a hackathon happen, should be proud of their teams.

Instead of trying to describe the indescribable, here are some photos:

BY THE NUMBERS

16 hours of code
13 teams
62 hackers
44 students
4 robots
568 croissants
0 lost-time incidents

I won't say much about the projects for now. The diversity was high — there were projects in thin section photography, 3D geological modeling, document processing, well log prediction, seismic modeling and inversion, and fault detection. All of the projects included some kind of machine learning, and again there was diversity there, including several deep learning applications. Neural networks are back!

Feel the buzz!

If you are curious, Gram and I recorded a quick podcast and interviewed a few of the teams:

It's going to take a few days to decompress and come down from the high. In a couple of weeks I'll tell you more about the projects themselves, and we'll edit the photos and post the best ones to Flickr (and in the meantime there are a few more pics there already). 

Thank you to the sponsors!

Last thing: we couldn't have done any of this without the support of Dell EMC. David Holmes has been a rock for the hackathon project over the last couple of years, and we appreciate his love of community and code! Thank you too to Duncan and Jane at Teradata, Francois at NVIDIA, Peter and Jon at Amazon AWS, and Gram at Sandstone for all your support. Dear reader: please support these organizations!