Cope don't fix

Some things genuinely are broken. International financial practices. Intellectual property law. Most well tie software. 

But some things are the way they are because that's how people like them. People don't like sharing files, so they stash their own. Result: shared-drive cancer — no, it's not just your shared drive that looks that way. The internet is similarly wild, chaotic, and wonderful — but no-one uses Yahoo! Directory to find stuff. When chaos is inevitable, the only way to cope is fast, effective search

So how shall we deal with the chaos of well log names? There are tens of thousands — someone at Schlumberger told me last week that they alone have over 50,000 curve and tool names. But these names weren't dreamt up to confound the geologist and petrophysicist — they reflect decades of tool development and innovation. There is meaning in the morasse.

Standards are doomed

Twelve years ago POSC had a go at organizing everything. I don't know for sure what became of the effort, but I think it died. Most attempts at standardization are doomed. Standards are awash with compromise, so they aren't perfect for anything. And they can't keep up with changes in technology, because they take years to change. Doomed.

Instead of trying to fix the chaos, cope with it.

A search tool for log names

We need a search tool for log names. Here are some features it should have:

  • It should be free, easy to use, and fast
  • It should contain every log and every tool from every formation evaluation company
  • It should provide human- and machine-readable output to make it more versatile
  • You should get a result for every search, never drawing a blank
  • Results should include lots of information about the curve or tool, and links to more details
  • Users should be able to flag or even fix problems, errors, and missing entries in the database

To my knowledge, there are only two tools a little like this: Schlumberger's Curve Mnemonic Dictionary, and the SPWLA's Mnemonics Data Search. Schlumberger's widget only includes their tools, naturally. The SPWLA database does at least include curves from Baker Hughes and Halliburton, but it's at least 10 years out of date. Both fail if the search term is not found. And they don't provide machine-readable output, only HTML tables, so it's difficult to build a service on them.

Introducing fuzzyLAS

We don't know how to solve this problem, but we're making a start. We have compiled a database containing 31,000 curve names, and a simple interface and web API for fuzzily searching it. Our tool is called fuzzyLAS. If you'd like to try it out, please get in touch. We'd especially like to hear from you if you often struggle with rogue curve mnemonics. Help us build something useful for our community.

Are you a poet or a mathematician?

Woolly ramsMany geologists can sometimes be rather prone to a little woolliness in their language. Perhaps because you cannot prove anything in geology (prove me wrong), or because everything we do is doused in interpretation, opinion and even bias, we like to beat about the bush. A lot.

Sometimes this doesn't matter much. We're just sparing our future self from a guilty binge of word-eating, and everyone understands what we mean—no harm done. But there are occasions when a measure of unambiguous precision is called for. When we might want to be careful about the technical meanings of words like approximately, significant, and certain.

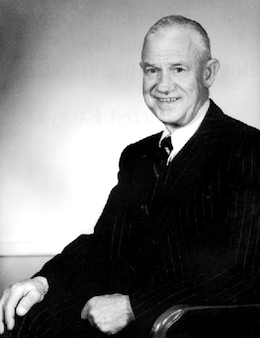
Sherman Kent was a CIA analyst in the Cold War, and he tasked himself with bringing quantitative rigour to the language of intelligence reports. He struggled (and eventually failed), meeting what he called aesthetic opposition:

Sherman Kent portraitWhat slowed me up in the first instance was the firm and reasoned resistance of some of my colleagues. Quite figuratively I am going to call them the poets—as opposed to the mathematicians—in my circle of associates, and if the term conveys a modicum of disapprobation on my part, that is what I want it to do. Their attitude toward the problem of communication seems to be fundamentally defeatist. They appear to believe the most a writer can achieve when working in a speculative area of human affairs is communication in only the broadest general sense. If he gets the wrong message across or no message at all—well, that is life.

Sherman Kent, Words of Estimative Probability, CIA Studies in Intelligence, Fall 1964

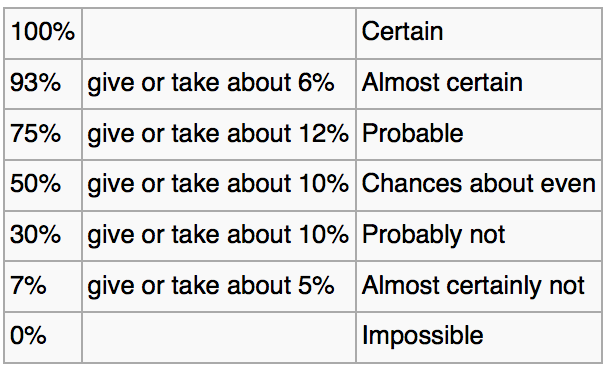
Words of estimative probabilityKent proposed using some specific words to convey specific levels of certainty (right). We have used these words in our mobile app Risk*. The only modification I made was setting P = 0.99 for Certain, and P = 0.01 for Impossible (see my remark about proving things in geology).

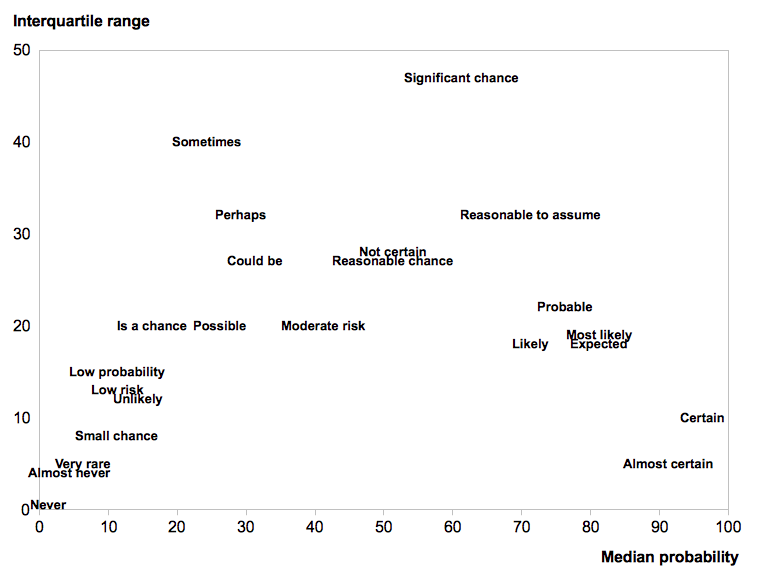
There are other schemes. Most petroleum geologists know Peter Rose's work. A common language, with some quantitative meaning, can dull the pain of prospect risking sessions. Almost certainly. Probably.

Do you use systematic descriptions of uncertainty? Do you think they help? How can we balance our poetic side of geology with the mathematical?

AVO* is free!

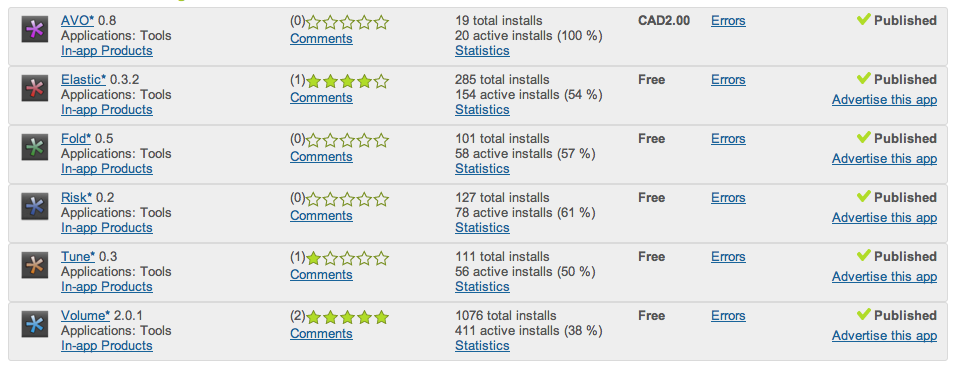
The two-bit experiment is over! We tried charging $2 for one of our apps, AVO*, as a sort of techno-socio-geological experiment, and the results are in: our apps want to be free. Here are our download figures, as of this morning: 

You also need to know when these apps came out. I threw some of the key statistics into SubSurfWiki and here's how they stack up when you account for how long they've been available:

It is clear that AVO* has performed quite poorly compared to its peers! The retention rate (installs/downloads) is 100% — the price tag buys you loyalty and even a higher perceived value perhaps? But the hit in adoption is too much to take. 

There are other factors: quality, relevance, usefulness, ease-of-use. It's hard to be objective, but I think AVO* is our highest quality app. It certainly has the most functionality, hence this experiment. It is rather niche: many geological interpreters may have no use for it. But it is certainly no more niche than Elastic*, and has about four times the functionality. On the downside, it needs an internet connection for most of its juicy bits.

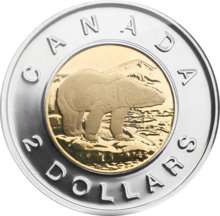
In all, I think that we might have expected 200 installs for the app by now, from about 400–500 downloads. I conclude that charging $2 has slowed down its adoption by a factor of ten, and hereby declare it free for everyone. It deserves to be free! If you were one of the awesome early adopters that paid a toonie for it, I have only this to say to you: we love you.

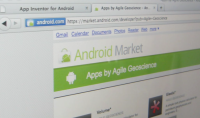
So, if you have an Android device, scan the code or otherwise hurry to the Android Market!

Building Tune*

Last Friday, I wrote a post on tuning effects in seismic, which serves as the motivation behind our latest app for Android™ devices, Tune*. I have done technical and scientific computing in the past, but I am a newcomer to 'consumer' software programming, so like Matt in a previous post about the back of the digital envelope, I thought I would share some of my experiences trying to put geo-computing on a mobile, tactile, always-handy platform like a phone.

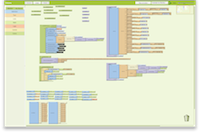
Google's App Inventor tool has two parts: the interface designer and the blocks editor. Programming with the blocks involves defining and assembling a series of procedures and variables that respond to the user interface. I made very little progress doing the introductory demos online, and only made real progress when I programmed the tuning equation itself—the science. The equation only accounts for about 10% of the blocks. But the logic, control elements, and defaults that (I hope) result in a pleasant design and user experience, take up the remainder of the work. This supporting architecture, enabling someone else to pick it up and use it, is where most of the sweat and tears go. I must admit, I found it an intimidating mindset to design for somebody else, but perhaps being a novice means I can think more like a user? 

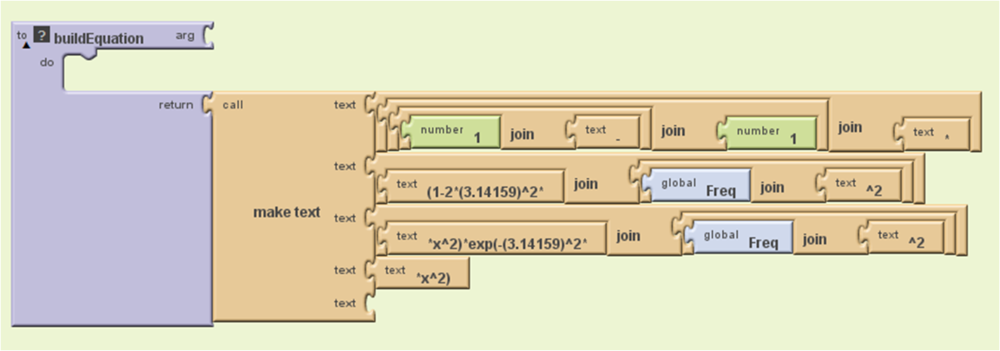
This screenshot shows the blocks that build the tuning equation I showed in last week's post. It makes a text block out of an equation with variables, and the result is passed to a graph to be plotted. We are making text because the plot is actually built by Google's Charts API, which is called by passing this equation for the tuning curve in a long URL. 

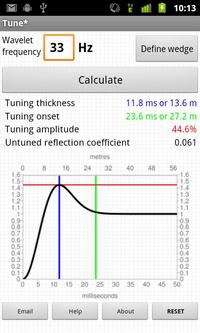
Agile Tune app screenshotUpcoming versions of this app will include handling the 3-layer case, whereby the acoustic properties above and below the wedge can be different. In the future, I would like to incorporate a third dimension into the wedge space, so that the acoustic properties or wavelet can vary in the third dimension, so that seismic response and sensitivity can be tested dynamically.

Even though the Ricker wavelet is the most commonly used, I am working on extending this to include other wavelets like Klauder, Ormsby, and Butterworth filters. I would like build a wavelet toolbox where any type of wavelet can be defined based on frequency and phase spectra. 

Please let me know if you have had a chance to play with this app and if there are other features you would like to see. You can read more about the science in this app on the wiki, or get it from the Android Market. At the risk (and fun) of nakedly exposing my lack of programming prowess to the world, I have put a copy of the package on the DOWNLOAD page, so you can grab Tune.zip, load it into App Inventor and check it out for yourself. It's a little messy; I am learning more elegant and parsimonious ways to build these blocks. But hey, it works!

Tuning geology

It's summer! We will be blogging a little less often over July and August, but have lots of great posts lined up so check back often, or subscribe by email to be sure not to miss anything. Our regular news feature will be a little less regular too, until the industry gets going again in September. But for today... here's the motivation behind our latest app for Android devices, Tune*.

Geophysicists like wedges. But why? I can think of only a few geological settings with a triangular shape; a stratigraphic pinchout or an angular unconformity. Is there more behind the ubiquitous geophysicist's wedge than first appears?

Seismic interpretation is partly the craft of interpreting artifacts, and a wedge model illustrates several examples of artifacts found in seismic data. In Widess' famous paper, How thin is a thin bed? he set out a formula for vertical seismic resolution, and constructed the wedge as an aid for quantitative seismic interpretation. Taken literally, a synthetic seismic wedge has only a few real-world equivalents. But as a purely quantitative model, it can be used to calibrate seismic waveforms and interpret data in any geological environment. In particular, seismic wedge models allow us to study how the seismic response changes as a function of layer thickness. For fans of simplicity, most of the important information from a wedge model can be represented by a single function called a tuning curve.

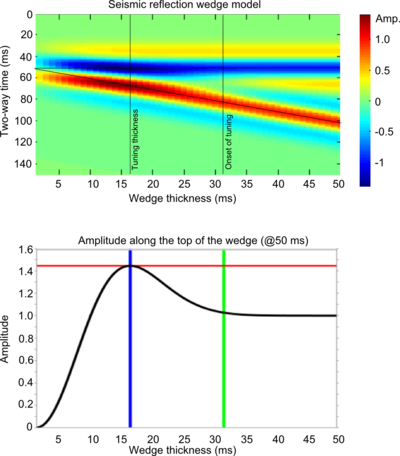
In this figure, a seismic wedge model is shown for a 25 Hz Ricker wavelet. The effects of tuning (or interference) are clearly seen as variations in shape, amplitude, and travel time along the top and base of the wedge. The tuning curve shows the amplitude along the top of the wedge (thin black lines). Interestingly, the apex of the wedge straddles the top and base reflections, an apparent mis-timing of the boundaries.

On a tuning curve there are (at least) two values worth noting; the onset of tuning, and the tuning thickness. The onset of tuning (marked by the green line) is the thickness at which the bottom of the wedge begins to interfere with the top of the wedge, perturbing the amplitude of the reflections, and the tuning thickness (blue line) is the thickness at which amplitude interference is a maximum.

For a Ricker wavelet the amplitude along the top of the wedge is given by:

where R is the reflection coefficient at the boundary, f is the dominant frequency and t is the wedge thickness (in seconds). Building the seismic expression of the wedge helps to verify this analytic solution.

Wedge artifacts

The synthetic seismogram and the tuning curve reveal some important artifacts that the seismic interpreter needs to know about, because they could be pitfalls, or they could provide geological information:

Bright (and dim) spots: A bed thickness equal to the tuning thickness (in this case 15.6 ms) has considerably more reflective power than any other thickness, even though the acoustic properties are constant along the wedge. Below the tuning thickness, the amplitude is approximately proportional to thickness.

Mis-timed events: Below 15 ms the apparent wedge top changes elevation: for a bed below the tuning thickness, and with this wavelet, the apparent elevation of the top of the wedge is actually higher by about 7 ms. If you picked the blue event as the top of the structure, you'd be picking it erroneously too high at the thinnest part of the wedge. Tuning can make it challenging to account for amplitude changes and time shifts simultaneously when picking seismic horizons.

Limit of resolution: For a bed thinner than about 10 ms, the travel time between the absolute reflection maxima—where you would pick the bed boundaries—is not proportional to bed thickness. The bed appears thicker than it actually is.

Bottom line: if you interpret seismic data, and you are mapping beds around 10–20 ms thick, you should take time to study the effects of thin beds. We want to help! On Monday, I'll write about our new app for Android mobile devices, Tune*. 

Reference

Widess, M (1973). How thin is a thin bed? Geophysics, 38, 1176–1180. 

Can you do science on a phone?

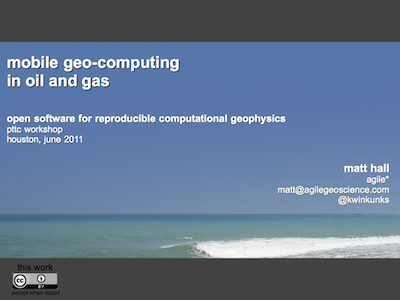
Mobile geo-computing presentationClick the image to download the PDF (3.5M) in a new window. The PDF includes slides and notes.Yes! Perhaps the real question should be: Would you want to? Isn't the very idea just an extension of the curse of mobility, never being away from your email, work, commitments? That's the glass half-empty view; it takes discipline to use your cellphone on your own terms, picking it up when it's convenient. And there's no doubt that sometimes it is convenient, like when your car breaks down, or you're out shopping for groceries and you can't remember if it was Winnie-the-Pooh or Disney Princess toothpaste you were supposed to get.

So smartphones are convenient. And everywhere. And most people seem to have a data plan or ready access to WiFi. And these devices are getting very powerful. So there's every reason to embrace the fact that these little computers will be around the office and lab, and get on with putting some handy, maybe even fun, geoscience on them. 

My talk, the last one of the meeting I blogged about last week, was a bit of an anomaly in the hardcore computational geophysics agenda. But maybe it was a nice digestif. You can read something resembling the talk by clicking on the image (above), or if you like, you can listen to me in this 13-minute video version:

So get involved, learn to program, or simply help and inspire a developer to build something awesome. Perhaps the next killer app for geologists, whatever that might be. What can you imagine...?

Just one small note to geoscience developers out there: we don't need any more seismographs or compass-clinometers!

To free, or not to free?

Yesterday, Evan and I published our fourth mobile app for geoscientists. It's called AVO*, it does reflectivity modeling, and it costs $2. 

Two bucks?? What's the point? Why isn't it free? Well, it went something like this...

- So, this new app: is it free?
- Well, all our apps are free. I guess it's free.
- Yeah, we don't want to stop it from spreading. If it wants to spread, that is...
- But does free look... worthless? I mean, 'you get what you pay for', right? Look at all the awesome stuff we pay for: Amazon web services, Squarespace web hosting, Hover domain hosting, awesome computers,...
- So what would we charge?
- What do other people charge? 
- There are no 'other people'... But there are technical apps for oil and gas out there. Most of them cost $1.99, some are $4.99, one or two are $9.99. Who knows how many downloads they get? 
- I bet the total revenue is constant: if you charge $1 and get 1000 downloads, then you'll get 100 at $10. But that's an experiment you can never do—once you've charged some amount, you can't really go up. Or down.
- How do other people decide what to charge?
- I guess traditionally you might use a cost-plus model: the cost of production, plus a profit margin.
- What's our cost of production?
- Well, a few days of time... let's call it $5000. If we wanted to make $10 000, and only expect 500 people to even be in the market... It doesn't work. No-one will pay $20 for a cell phone widget.
- Won't they just expense it?
- Maybe... I don't think the industry is quite there yet.
- Hmm... I downloaded an app for $20 once [a seismograph]. And another for $10 [a banjo tuner]. I don't even think about paying $1 or $2. That amount is basically free. $1 is free.
- But a buck... isn't it just a pain to even get your credit card out?
- Well, once you're set up in Google Checkout, or iTunes or whatever, it's essentially one click. And then we get a sense of the real user base. The hard core!
- Yeah... right now about 50% of people who install an app nuke it a few days later.
- At least if it's under $5 we probably won't have to deal with refunds and other nonsense.
- Arrgghhhh... why is this so hard? 
- Let's make it $2. 
- Let's make it free.
- But this app is awesome. Awesome shouldn't be free. Awesome is never free. Awesome costs. 
- But isn't this really just a thing that says "Agile is awesome, check us out, hire us"? It's marketing.
- Maybe... but it's useful too. It works. It does something. It has Science Inside™. People will get $1-worth out of it every time they use it. If this was a <insert energy software empire> app it would cost $10 000.
- Can we ask people to pay what they want? Like what Radiohead did with In Rainbows?
- No because they're already huge. They invoke mass hysteria in grown men. We don't invoke mass hysteria. Among anyboy.
- Damn. OK. Let's make it nearly free. As-good-as-free. Free-ish. Pseudo-free. Free*.
- $2?
- $2.

So the app costs a toonie, and we promise you won't regret it for a second. If you can't afford it, email us and we'll send you a free one. If you really hate it, email us and we'll send you $3.

Volumetrics on the back of a digital envelope

A few weeks ago we launched our first mobile app, Volume*, now available in the Android Market (you can jump right to it with the barcode on the right). If you have an Android phone or tablet, please check it out! Today, I thought I'd write a bit more about I built the app, show you some of the gory details, and tell you about the latest update.

Read More