Looking forward to AAPG

Today we're en route to the AAPG Annual Convention & Exhibition (the ACE) in Houston. We have various things going on before it and after it too, so we're in Houston for 10 days of geoscience. Epic!

The appetizers

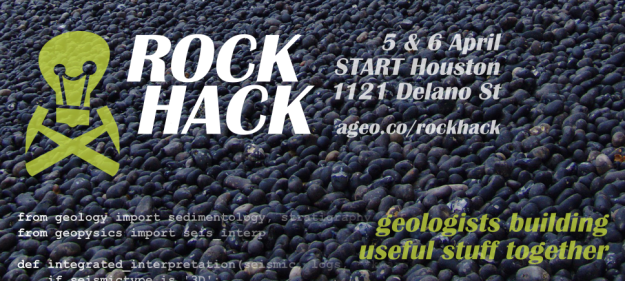
On Friday we're hosting a 'learning geoscience programming' bootcamp at START, our favourite Houston coworking space. Then we roll straight into our weekend programming workshop — Rock Hack — also at START. Everyone is welcome — programming newbies, established hackers. We want to build tools for working with well logs. You don't need any special skills, just ideas. Bring whatever you have! We'll be there from 8 am on Saturday. (Want more info?)

At least come for the breakfast tacos.

Conference highlight forecast

Regular readers will know that I'm a bit of a jaded conference-goer. But I haven't been to AAPG since Calgary in 2005, and I am committed to reporting the latest in geoscience goodness — so I promise to go to some talks and report back on this very blog. I'm really looking forward to it since Brian Romans whet my appetite with a round-up of his group's research offerings last week. 

I thought I'd share what else I'll be trying to get to. I can't find a way to link to the abstracts — you'll have to hunt them down in the Itinerary Planner... 

  • Monday am. Communicating our science. Jim Reilly, Iain Stewart, and others.
  • Monday pm. Case Studies of Geological and Geophysical Integration sounds okay, but might under-deliver. And there's a talk called 3-D Printing Artificial Reservoir Rocks to Test Their Petrophysical Properties, by Sergey Ishutov that should be worth checking out.
  • Tuesday am.  Petroleum Geochemistry and Source Rock Characterization, in honour of Wally Dow
  • Tuesday pm. Turbidites and Contourites, Room 360, is the place to be. Zane Jobe is your host.
  • Wednesday am. I'll probably end up in Seismic Visualization of Hydrocarbon Play Fairways.
  • Wednesday pm. Who can resist Space and Energy Frontiers? Not me.

That's about it. I'm teaching my geoscience writing course at a client's offices on Friday, then heading home. Evan will be hanging out and hacking some more I expect. Expect some updates to modelr.io!

If you're reading this, and you will be at AAPG — look out for us! We'll be the ones sitting on the floor near electrical outlets, frantically typing blog posts.

Getting started with Modelr

Let's take a closer look at modelr.io, our new modeling tool. Just like real seismic experiments, there are four components:

  • Make a framework. Define the geometries of rock layers.
  • Make an earth. Assign a set of rock properties to each layer.
  • Make a kernel. Define the seismic survey.
  • Make a plot. Set the output parameters.

Modelr takes care of the physics of wave propagation and reflection, so you don't have to stick with normal incidence acoustic impedance models if you don't want to. You can explore the full range of possibilities.

3 ways to slice a wedge

To the uninitiated, the classic 3-layer wedge model may seem ridiculously trivial. Surely the earth looks more complicated than that! But we can leverage such geometric simplicity to systematically study how seismic waveforms change across spatial and non-spatial dimensions. 

Spatial domain. In cross-section (right), a seismic wedge model lets you analyse the resolving power of a given wavelet. In this display the onset of tuning is marked by the vertical red line, and the thickness at which maximum tuning occurs is shown in blue. Reflection profiles can be shown for any incidence angle, or range of incidence angles (offset stack).

Amplitude versus angle (AVA) domain. Maybe you are working on a seismic inversion problem so you might want to see what a CDP angle gather looks like above and below tuning thickness. Will a tuned AVA response change your quantitative analysis? This 3-layer model looks like a two-layer AVA gather except our original wavelet looks like it has undergone a 90 degree phase rotation. Looks can be deceiving. 

Amplitude versus frequency domain. If you are trying to design a seismic source for your next survey, and you want to ensure you've got sufficient bandwidth to resolve a thin bed, you can compute a frequency gather — right, bottom — and explore a swath of wavelets with regard to critical thickness in your prospect. The tuning frequency (blue) and resolving frequency (red) are revealed in this domain as well. 

Wedges are tools for seismic waveform classification. We aren't just interested in digitizing peaks and troughs, but the subtle interplay of amplitude tuning, and apparent phase rotation variations across the range of angles and bandwidths in the seismic experiment. We need to know what we can expect from the data, from our supposed geology. 

In a nutshell, all seismic models are about illustrating the band-limited nature of seismic data on specific geologic scenarios. They help us calibrate our intuition when bandwidth causes ambiguity in interpretation. Which is nearly all of the time.

How to load SEG-Y data

Yesterday I looked at the anatomy of SEG-Y files. But it's pathology we're really interested in. Three times in the last year, I've heard from frustrated people. In each case, the frustration stemmed from the same problem. The epic email trails led directly to these posts. Next time I can just send a URL!

In a nutshell, the specific problem these people experienced was missing or bad trace location data. Because I've run into this so many times before, I never trust location data in a SEG-Y file. You just don't know where it's been, or what has happened to it along the way — what's the datum? What are the units? And so on. So all you really want to get from the SEG-Y are the trace numbers, which you can then match to a trustworthy source for the geometry.

Easy as 1-2-3, er, 4

This is my standard approach to loading data. Your mileage will vary, depending on your software and your data. 

  1. Find the survey geometry information. For 2D data the geometry is usually in a separate navigation ('nav') file. For 3D you are just looking for cornerpoints, and something indicating how the lines and crosslines are numbered (they might not start at 1, and might not be oriented how you expect). This information may be in the processing report or, less reliably, in the EBCDIC text header of the SEG-Y file.
  2. Now define the survey geometry. You need a location for every trace for a 2D, and the survey's cornerpoints for a 3D. The geometry is a description of where the line goes on the earth, in surface coordinates, and where the starting trace is, how many traces there are, and what the trace spacing is. In other words, the geometry tells you where the traces go. It's variously called 'navigation', 'survey', or some other synonym.
  3. Finally, load the traces into their homes, one vintage (survey and processing cohort) at a time for 2D. The cross-reference between the geometry and the SEG-Y file is the trace or CDP number for a 2D, and the line and crossline numbers for a 3D.
  4. Check everything twice. Does the map look right? Is the survey the right shape and size? Is the line spacing right? Do timeslices look OK?

Where to get the geometry data?

So, where to find cornerpoints, line spacings, and so on? Sadly, the header cannot be trusted, even in newly-processed data. If you have it, the processing report is a better bet. It often helps to talk to someone involved in the acquisition and processing too. If you can corroborate with data from the acqusition planning (line spacings, station intervals, and so on), so much the better — but remember that some acquisition parameters may have changed during the job.

Of vital importance is some independent corroboration— a map, ideally —of the geometry and the shape and orientation of the survey. I can't count the number of back-to-front surveys I've seen. I even saw one upside-down (in the z dimension) once, but that's another story.

Next time, I'll break down the loading process a bit more, with some step-by-step for loading the data somewhere you can see it.

Calibrate your seismic intuition

On Tuesday we announced our new web app, modelr.io. Why are we so excited about it? 

  • We love the idea that subsurface software can cost dollars, not 1000's of dollars. 
  • We love the idea of subsurface software being online, not on the desktop.
  • We love the idea that subsurface software can be open source. Here's our code!
  • We love the idea of subsurface software that doesn't need a manual to master.
  • We love the idea of subsurface software that runs on a tablet or a phone.
  • We see software as an important way to share knowledge and connect people.

OK, that's enough reasons. There are more. Those are the main ones.

The point is: we love these ideas. And we hope that you, dear reader, at least like some of them a bit. Because we really want to keep developing modelr. We think it can be awesome. Imagine 3D earth models, imagine full waveform modeling, imagine gravity and magnetic models. We get very excited when we think about all the possiblities. There's no better way to calibrate your seismic intuition than modeling, and modelr is a great place to start modeling. 

Here's a challenge: take 3 minutes and see if you can generate...

 A wedge model & tuning curve An AVA gather for a Class 4 sand    A stochastic AVA crossplot          

 modelr seismic wedge modelmodelr seismic avo modelmodelr stochastic avo  model

The most important thing nobody does

A couple of weeks ago, we told you we were up to something. Today, we're excited to announce modelr.io — a new seismic forward modeling tool for interpreters and the seismically inclined.

Modelr is a web app, so it runs in the browser, on any device. You don't need permission to try it, and there's never anything to install. No licenses, no dongles, no not being able to run it at home, or on the train.

Later this week, we'll look at some of the things Modelr can do. In the meantime, please have a play with it.
Just go to modelr.io and hit Demo, or click on the screenshot below. If you like what you see, then think about signing up — the more support we get, the faster we can make it into the awesome tool we believe it can be. And tell your friends!

If you're intrigued but unconvinced, sign up for occasional news about Modelr:

This will add you to the email list for the modeling tool. We never share user details with anyone. You can unsubscribe any time.

Relentlessly practical

This is one of my favourite knowledge sharing stories.

A farmer in my community had a problem with one of his cows — it was seriously unwell. He asked one of the old local farmers about the symptoms, and was told, “Oh yes, one of my herd had the same thing last summer. I gave her a cup of brandy and four aspirins every night for a week.” The young farmer went off and did this, but the poor cow got steadily worse and died. When he saw the old farmer next he told him, more than a little accusingly, “I did what you said, and the cow died anyway.” The old geezer looked into the distance and just said, “Yep, so did mine.”

Incomplete information can be less useful than no information. Yet incomplete information has somehow become our specialty in applied geoscience. How often do we share methods, results, or case studies without the critical details that would make it useful information? That is, not just marketing, or resumé padding. Inded, I heard this week that one large US operator will not approve a publication that does include these critical details! And we call ourselves scientists...

Completeness mandatory

Thankfully, Last month The Leading Edge — the magazine of the SEG — started a new tutorial column, edited by me. Well, I say 'edited', I'm just the person that pesters prospective authors until they give in and send me a manuscript. Tad Smith, Don Herron, and Jenny Kucera are the people that make it actually happen. But I get to take all the credit.

When I was asked about it, I suggested two things:

  1. Make each tutorial reproducible by publishing the code that makes the figures.
  2. Make the words, the data, and the code completely open and shareable. 

To my delight and, I admit, slight surprise, they said 'Sure!'. So the words are published under an open license (Creative Commons Attribution-ShareAlike, the same license for re-use that most of Wikipedia has), the tutorials use open data for everything, and the code is openly available and free to re-use. Complete transparency.

There's another interesting aspect to how the column is turning out. The first two episodes tell part of the story in IPython Notebook, a truly amazing executable writing environment that we've written about before. This enables you to seamlessly stich together text, code, and plots (left). If you know a bit of Python, or want to start learning it right now this second, go give wakari.io a try. It's pretty great. (If you really like it, come and learn more with us!).

Read the first tutorial: Hall, M. (2014). Smoothing surfaces and attributes. The Leading Edge, 33(2), 128–129. doi: 10.1190/tle33020128.1. A version of it is also on SEG Wiki, and you can read the IPython Notebook at nbviewer.org.

Do you fancy authoring something for this column? Wonderful — please do! Here are the author instructions. If you have an idea for something, please drop me a line, let's talk about how to make it relentlessly practical.

A long weekend of Atlantic geology

The Atlantic Geoscience Society Colloquium was hosted by Acadia University in Wolfville, Nova Scotia, this past weekend. It was the 50th Anniversay meeting, and attracted a crowd of about 175 geoscientists. A few members were able to reflect and tell stories first-hand of the first meeting in 1964.

It depends which way you slice it

Nova Scotia is one of the best places for John Waldron to study deformed sedimentary rocks of continental margins and orogenic belts. Being the anniversary, John traced the timeline of tectonic hypotheses over the last 50 years. From his kinematic measurements of Nova Scotia rocks, John showed the complexity of transtensional tectonics. It is easy to be fooled: you will see contraction features in one direction, and extension structures in another direction. It all depends which way you slice it. John is a leader in visualizing geometric complexity; just look at this animation of piecing together a coal mine in Stellarton. Oh, and he has a cut and fold exercise so that you can make your own Grand Canyon! 

The application of the Law of the Sea

In September 2012 the Bedford Institute of Oceanography acquired some multibeam bathymetric data and applied geomorphology equations to extend Canada's boundaries in the Atlantic Ocean. Calvin Campbell described the cruise as like puttering from Halifax to Victoria and back at 20 km per hour, sending a chirp out once a minute, each time waiting for it to go out 20 kilometres and come back.

The United Nation's Convention on the Law of the Sea (UNCLOS) was established to define the rights and responsibilities of nations in their use of the world's oceans, establishing guidelines for businesses, the environment, and the management of marine natural resources. A country is automatically entitled to any natural resources found within a 200 nautical mile limit of its coastlines, but can claim a little bit more if they can prove they have sedimentary basins beyond that. 

Practicing the tools of the trade

Taylor Campbell, applied a post-stack seismic inversion workflow to the Penobscot 3D survey and wells. Compared to other software talks I have seen in industry, Taylor's was a quality piece of integrated technical work. This is even more commendable considering she is an undergraduate student at Dalhousie. My only criticism, which I shared with her after the talk was over, was that the work lacked a probing question. It would have served as an anchor for the work, and I think is one of the critical distinctions between scientific pursuits and engineering.

Image courtesy of Justin Drummond, 2014, personal communication, from his expanded abstract presented at GSA 2013.

Practicing rational inquiry

Justin Drummond's work, on the other hand, started with a nugget of curiosity: How did the biogeochemical cycling of phosphorite change during the Neoproterozoic? Justin's anchoring question came first, only then could he think about the methods, technologies and tools he needed to employ, applying sedimentology, sequence stratigraphy, and petrology to investigate phosphorite accumulation in the Sete Lagoas Formation. He won the award for Best Graduate Student presentation at the conference.

It is hard to know if he won because his work was so good, or if it was because of his impressive vocabulary. He put me in mind of what Rex Murphy would sound like if he were a geologist.

The UNCLOS illustration is licensed CC-BY-SA, by Wikipedia users historicair and MJSmit.

Atlantic geology hits Wikipedia

WikiProject Geology is one of the gathering places for geoscientists in Wikipedia.Regular readers of this blog know that we're committed to open scientific communication, and that we're champions of wikis as one of the venues for that communication, and that we want to see more funky stuff happen at conferences. In this spirit, we hosted a Wikipedia editing session at the Atlantic Geoscience Society Colloquium in Wolfville, Nova Scotia, this past weekend. 

As typically happens with these funky sessions, it wasn't bursting at the seams: The Island of Misfit Toys is not overcrowded. There were only 7 of us: three Agilistas, another consultant, a professor, a government geologist, and a student. But it's not the numbers that matter (I hope), it's the spirit of the thing. We were a keen bunch and we got quite a bit done. Here are the articles we started or built upon:

The birth of the Atlantic Geoscience Society page gave the group an interesting insight into Wikipedia's quality control machine. Within 10 minutes of publishing it, the article was tagged for speedy deletion by an administrator. This sort of thing is always a bit off-putting to noobs, because Wikipedia editors can be a bit, er, brash, or at least impersonal. This is not that surprising when you consider that new pages are created at a rate of about one a minute some days. Just now I resurrected a stripped-down version of the article, and it has already been reviewed. Moral: don't let anyone tell you that Wikipedia is a free-for-all.

All of these pages are still (and always will be) works in progress. But we added 5 new pages and a substantial amount of material with our 28 or so hours of labour. Considering most of those who came had never edited a wiki before, I'm happy to call this a resounding success. 

Much of my notes from the event could be adapted to any geoscience wiki editing session — use them as a springboard to get some champions of open-access science together at your next gathering. If you'd like our help, get in touch.

Rock Hack 2014

We're hosting another hackathon! This time, we're inviting geologists in all their colourful guises to come and help dream up cool tools, find new datasets, and build useful stuff. Mark your calendar: 5 & 6 April, right before AAPG.

On 4 April there's the added fun of a Creative geocomputing course. So you can learn some skills, then put them into practice right away. More on the course next week.

What's a hackathon?

It's not as scary — or as illegal — as it sounds! And it's not just for coders. It's just a roomful of creative geologists and friendly programmers figuring out two things together:

  1. What tools would help us in our work?
  2. How can we build those tools?

So for example, we might think about problems like these:

  • A sequence stratigraphy calibration app to tie events to absolute geologic time
  • Wireline log 'attributes'
  • Automatic well-to-well correlation
  • Facies recognition from core
  • Automatic photomicrograph interpretation: grain size, porosity, sorting, and so on
  • A mobile app for finding and capturing data about outcrops
  • Sedimentation rate analysis, accounting for unconformities, compaction, and grain size

I bet you can think of something you'd like to build — add it to the list!

Still not sure? Check out what we did at the Geophysics Hackathon last autumn...

How do I sign up?

You can sign up for the creative geocomputing course at Eventbrite.

If you think Rock Hack sounds like a fun way to spend a weekend, please drop us a line or sign up at Hacker League. If you're not sure, please come anyway! We love visitors.

If you think you know someone who'd be up for it, let them know with the sharing buttons below.

The poster image is from an original work by Flickr user selkovjr.

January linkfest

Time for the quarterly linkfest! Got stories for next time? Contact us.

BP's new supercomputer, reportedly capable of about 2.2 petaflops, is about as fast as Total's Pangea machine in Paris, which booted up almost a year ago. These machines are pretty amazing — Pangea has over 110,000 cores, and 442 terabytes of memory — but BP claims to have bested that with 1 petabyte of RAM. Remarkable. 

Leo Uieda's open-source modeling tool Fatiando a Terra got an upgrade recently and hit version 0.2. Here's Leo himself demonstrating a forward seismic model:

I'm a geoscientst, get me out of here is a fun-sounding new educational program from the European Geosciences Union, which has recently been the very model of a progressive technical society (along with the AGU is another great example). It's based on the British outreach program, I'm a scientist, get me out of here, and if you're an EGU member (or want to be), I think you should go for it! The deadline: 17 March, St Patrick's Day.

Darren Wilkinson writes a great blog about some of the geekier aspects of geoscience. You should add it to your reader (I'm using The Old Reader to keep up with blogs since Google Reader was marched out of the building). He wrote recently about this cool tool — an iPad controller for desktop apps. I have yet to try it, but it seems a good fit for tools like ArcGIS, Adobe Illustrator.

Speaking of big software, check out Joe Kington's Python library for GeoProbe volumes — I wish I'd had this a few years ago. Brilliant.

And speaking of cool tools, check out this great new book by technology commentator and philosopher Kevin Kelly. Self-published and crowd-sourced... and drawn from his blog, which you can obviously read online if you don't like paper. 

If you're in Atlantic Canada, and coming to the Colloquium next weekend, you might like to know about the wikithon on Sunday 9 February. We'll be looking for articles relevant to geoscientists in Atlantic Canada to improve. Tim Sherry offers some inspiration. I would tell you about Evan's geocomputing course too... but it's sold out.

Heard about any cool geostuff lately? Let us know in the comments.