The evolution of open mobile geocomputing

A few weeks ago I attended the EAGE conference in Copenhagen (read my reports on Day 2 and Day 3). I presented a paper at the open source geoscience workshop on the last day, and wanted to share it here. I finally got around to recording it:

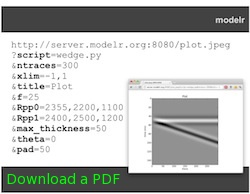
As at the PTTC Open Source workshop last year (Day 1Day 2, and my presentation), I focused on mobile geocomputing — geoscience computing on mobile devices like phones and tablets. The main update to the talk was a segment on our new open source web application, Modelr. We haven't written about this project before, and I'd be the first to admit it's rather half-baked, but I wanted to plant the kernel of awareness now. We'll write more on it in the near future, but briefly: Modelr is a small web app that takes rock properties and model parameters, and generates synthetic seismic data images. We hope to use it to add functionality to our mobile apps, much as we already use Google's chart images. Stay tuned!

If you're interested in seeing what's out there for geoscience, don't miss our list of mobile geoscience apps on SubSurfWiki! Do add any others you know of.

Two decades of geophysics freedom

This year is the 20th anniversary of the release of Seismic Un*x as free software. It is six years since the first open software workshop at EAGE. And it is one year since the PTTC open source geoscience workshop in Houston, where I first met Karl Schleicher, Joe Dellinger, and a host of other open source advocates and developers. The EAGE workshop on Friday looked back on all of this, surveyed the current landscape, and looked forward to an ever-increasing rate of invention and implementation of free and open geophysics software.

Rather than attempting any deep commentary, here's a rundown of the entire day. Please read on...

Read More

The Agile toolbox

Some new businesses go out and raise millions in capital before they do anything else. Not us — we only do what we can afford. Money makes you lazy. It's technical consulting on a shoestring!

If you're on a budget, open source is your best friend. More than this, it's important an open toolbox is less dependent on hardware and less tied to workflows. Better yet, avoiding large technology investments helps us avoid vendor lock-in, and the resulting data lock-in, keeping us more agile. And there are two more important things about open source: 

  • You know exactly what the software does, because you can read the source code
  • You can change what the software does, becase you can change the source code

Anyone who has waited 18 months for a software vendor to fix a bug or add a feature, then 18 more months for their organization to upgrade the software, knows why these are good things.

So what do we use?

In the light of all this, people often ask us what software we use to get our work done.

Hardware  Matt is usually on a dual-screen Apple iMac running OS X 10.6, while Evan is on a Samsung Q laptop (with a sweet solid-state drive) running Windows. Our plan, insofar as we have a plan, is to move to Mac Pro as soon as the new ones come out in the next month or two. Pure Linux is tempting, but Macs are just so... nice.

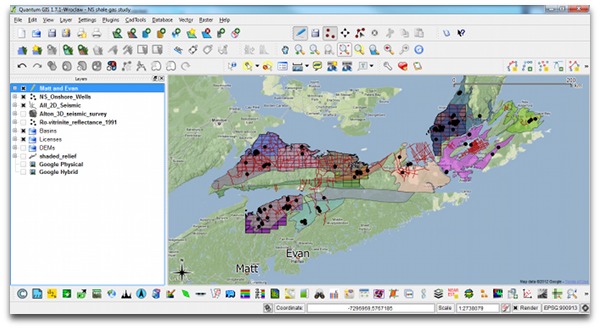
Geoscience interpretation  dGB OpendTect, GeoCraftQuantum GIS (above). The main thing we lack is a log visualization and interpretation tool. Beyond this, we don't use them much yet but Madagascar and GMT are plugged right into OpendTect. For getting started on stratigraphic charts, we use TimeScale Creator

A quick aside, for context: when I sold Landmark's GeoProbe seismic interpretation tool, back in 2003 or so, the list price was USD140 000 per user, choke, plus USD25k per year in maintenance. GeoProbe is very powerful now (and I have no idea what it costs), but OpendTect is a much better tool that that early edition was. And it's free (as in speech, and as in beer).

Geekery, data mining, analysis  Our core tools for data mining are Excel, Spotfire Silver (an amazing but proprietary tool), MATLAB and/or GNU Octave, random Python. We use Gephi for network analysis, FIJI for image analysis, and we have recently discovered VISAT for remote sensing images. All our mobile app development has been in MIT AppInventor so far, but we're playing with the PhoneGap framework in Eclipse too. 

Writing and drawing  Google Docs for words, Inkscape for vector art and composites, GIMP for rasters, iMovie for video, Adobe InDesign for page layout. And yeah, we use Microsoft Office and OpenOffice.org too — sometimes it's just easier that way. For managing references, Mendeley is another recent discovery — it is 100% awesome. If you only look at one tool in this post, look at this.

Collaboration  We collaborate with each other and with clients via SkypeDropbox, Google+ Hangouts, and various other Google tools (for calendars, etc). We also use wikis (especially SubSurfWiki) for asynchronous collaboration and documentation. As for social media, we try to maintain some presence in Google+, Facebook, and LinkedIn, but our main channel is Twitter.

Web  This website is hosted by Squarespace for reliability and reduced maintenance. The MediaWiki instances we maintain (both public and private) are on MediaWiki's open source platform, running on Amazon's Elastic Compute servers for flexibility. An EC2 instance is basically an online Linux box, running Ubuntu and Bitnami's software stack, plus some custom bits and pieces. We are launching another website soon, running WordPress on Amazon EC2. Hover provides our domain names — an awesome Canadian company.

Administrative tools  Every business has some business tools. We use Tick to track our time — it's very useful when working on multiple projects, subscontractors, etc. For accounting we recently found Wave, and it is the best thing ever. If you have a small business, please check it out — after headaches with several other products, it's the best bean-counting tool I've ever used.

If you have a geeky geo-toolbox of your own, we'd love to hear about it. What tools, open or proprietary, couldn't you live without?

A mixing board for the seismic symphony

Seismic processing is busy chasing its tail. OK, maybe an over-generalization, but researchers in the field are very skilled at finding incremental—and sometimes great—improvements in imaging algorithms, geometric corrections, and fidelity. But I don't want any of these things. Or, to be more precise: I don't need any more. 

Reflection seismic data are infested with filters. We don't know what most of these filters look like, and we've trained ourselves to accept and ignore them. We filter out the filters with our intuition. And you know where intuition gets us.

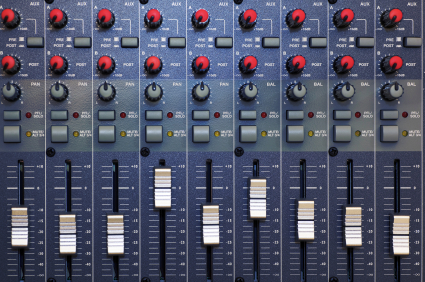
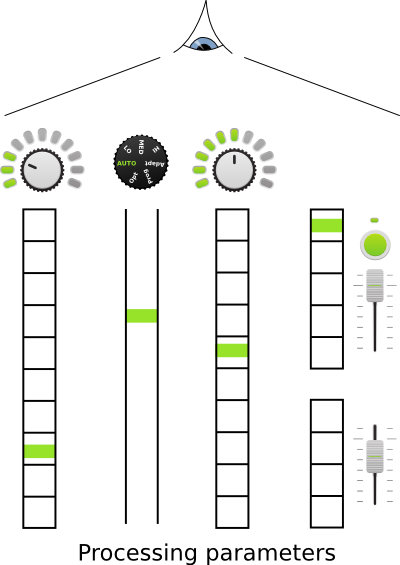
Mixing boardIf I don't want reverse-time, curved-ray migration, or 7-dimensional interpolation, what do I want? Easy: I want to see the filters. I want them perturbed and examined and exposed. Instead of soaking up whatever is left of Moore's Law with cluster-hogging precision, I would prefer to see more of the imprecise stuff. I think we've pushed the precision envelope to somewhere beyond the net uncertainty of our subsurface data, so that quality and sharpness of the seismic image is not, in most cases, the weak point of an integrated interpretation.

So I don't want any more processing products. I want a mixing board for seismic data.

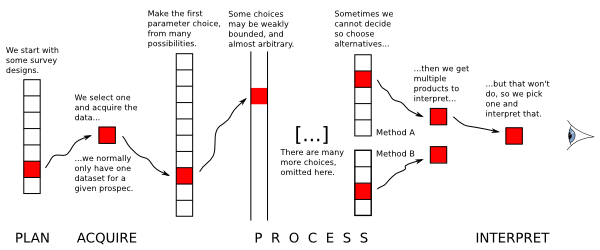
To fully appreciate my point of view, you need to have experienced a large seismic processing project. It's hard enough to process seismic, but if there is enough at stake—traces, deadlines, decisions, or just money—then it is almost impossible to iterate the solution. This is rather ironic, and unfortunate. Every decision, from migration aperture to anisotropic parameters, is considered, tested, and made... and then left behind, never to be revisited.

Linear seismic processing flow

But this linear model, in which each decision is cemented onto the ones before it, seems unlikely to land on the optimal solution. Our fateful string of choices may lead us to a lovely spot, with a picnic area and clean toilets, but the chances that it is the global maximum, which might lie in a distant corner of the solution space, seem slim. What if the spherical divergence was off? Perhaps we should have interpolated to a regularized geometry. Did we leave some ground roll in the data? 

Seismic processing mixing boardLook, I don't know the answer. But I know what it would look like. Instead of spending three months generating the best-ever migration, we'd spend three months (maybe less) generating a universe of good-enough migrations. Then I could sit at my desk and—at least with first order precision—change the spherical divergence, or see if less aggressive noise attenuation helps. A different migration algorithm, perhaps. Maybe my multiples weren't gone after all: more radon!

Instead of looking along the tunnel of the processing flow, I want the bird's eye view of all the possiblities. 

If this sounds impossible, that's because it is impossible, with today's approach: process in full, then view. Why not just do this swath? Ray trace on the graphics card. Do everything in memory and make me buy 256GB of RAM. The Magic Earth mentality of 2001—remember that?

Am I wrong? Maybe we're not even close to good-enough, and we should continue honing, at all costs. But what if the gains to be made in exploring the solution space are bigger than whatever is left for image quality?

I think I can see another local maximum just over there...

Mixing board image: iStockphoto.

Open up

After a short trip to Houston, today I am heading to London, Ontario, for a visit with Professor Burns Cheadle at the University of Western Ontario. I’m stoked about the trip. On Saturday I’m running my still-developing course on writing for geoscientists, and tomorrow I’m giving the latest iteration of my talk on openness in geoscience. I’ll post a version of it here once I get some notes into the slides. What follows is based on the abstract I gave Burns.

A recent survey by APEGBC's Innovation magazine revealed that geoscience is not among the most highly respected professions. Only 20% of people surveyed had a ‘great deal of respect’ for geologists and geophysicists, compared to 30% for engineers, and 40% for teachers. This is far from a crisis, but as our profession struggles to meet energy demands, predict natural disasters, and understand environmental change, we must ask, How can we earn more trust? Perhaps more openness can help. I’m pretty sure it can’t hurt.

Many people first hear about ‘open’ in connection with software, but open software is just one point on the open compass. And even though open software is free, and can spread very easily in principle, awareness is a problem—open source marketing budgets are usually small. Open source widgets are great, but far more powerful are platforms and frameworks, because these allow geoscientists to focus on science, not software, and collaborate. Emerging open frameworks include OpendTect and GeoCraft for seismic interpretation, and SeaSeis and BotoSeis for seismic processing.

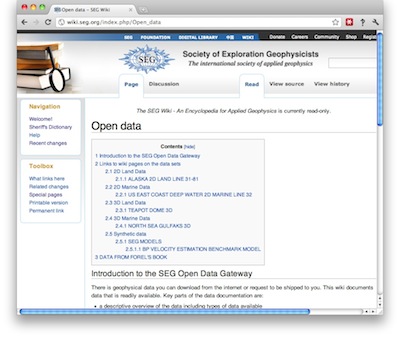
If open software is important for real science, then open data are equally vital because they promote reproducibility. Compared to the life sciences, where datasets like the Human Genome Project and Visible Human abound, the geosciences lag. In some cases, the pieces exist already in components like government well data, the Open Seismic Repository, and SEG’s list of open datasets, but they are not integrated or easy to find. In other cases, the data exist but are obscure and lack a simple portal. Some important plays, of global political and social as well as scientific interest, have little or no representation: industry should release integrated datasets from the Athabasca oil sands and a major shale gas play as soon as possible.

Open workflows are another point, because they allow us to accelerate learning, iteration, and failure, and thus advance more quickly. We can share easily but slowly and inefficiently by publishing, or attending meetings, but we can also write blogs, contribute to wikis, tweet, and exploit the power of the internet as a dynamic, multi-dimensional network, not just another publishing and consumption medium. Online readers respond, get engaged, and become creators, completing the feedback loop. The irony is that, in most organizations, it’s easier to share with the general public, and thus competitors, than it is to share with colleagues.

The fourth point of the compass is in our attitude. An open mindset recognizes our true competitive strengths, which typically are not our software, our data, or our workflows. Inevitably there are things we cannot share, but there’s far more that we can. Industry has already started with low-risk topics for which sharing may be to our common advantage—for example safety, or the environment. The question is, can we broaden the scope, especially to the subsurface, and make openness the default, always asking, is there any reason why I shouldn’t share this?

In learning to embrace openness, it’s important to avoid some common misconceptions. For example, open does not necessarily mean free-as-in-beer. It does not require relinquishing ownership or rights, and it is certainly not the same as public domain. We must also educate ourselves so that we understand the consequences of subtle and innocuous-seeming clauses in licences, for example those pertaining to non-commerciality. If we can be as adept in this new language as many of us are today in intellectual property law, say, then I believe we can accelerate innovation in energy and build trust among our public stakeholders.

So what are you waiting for? Open up!

Learn to program

This is my contribution to the Accretionary Wedge geoblogfest, number 38: Back to School. You can read all about it, and see the full list of entries, over at Highly Allochthonous. To paraphrase Anne's call to words:

What do you think students should know? What should universities be doing better? What needs do you see for the rising generation of geoscientists? What skills and concepts are essential? How important are things like communication and quantitative skills versus specific knowledge about rocks/water/maps?

Learn to program

The first of doubtless many moments of envy of my kids' experience of childhood came about two years ago when my eldest daughter came home from school and said she'd been programming robots. Programming robots. In kindergarten. 

For the first time in my life, I wished I was five. 

Most people I meet and work with do not know how to make a computer do what they want. Instead, they are at the mercy of the world's programmers and—worse—their IT departments. The accident of the operating system you run, the preferences of those that came before you, and the size of your budget should not determine the analyses and visualizations you can perform on your data. When you read a paper about some interesting new method, imagine being able to pick up a keyboard and just try it, right now... or at least in an hour or two. This is how programmers think: when it comes to computers at least, their world is full of possibility, not bound by software's edges or hardwired defaults.

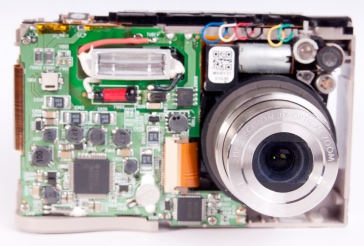
Stripped down cameraI want to be plain about this though: I am not suggesting that all scientists should become programmers, hacking out code, testing, debugging, and doing no science. But I am suggesting that all scientists should know how computer programs work, why they work, and how to tinker. Tinkering is an underrated skill. If you can tinker, you can play, you can model, you can prototype and, best of all, you can break things. Breaking things means learning, rebuilding, knowing, and creating. Yes: breaking things is creative.

But there's another advantage to learning to program a computer. Programming is a special kind of problem-solving, and rewards thought and ingenuity with the satisfaction of immediate and tangible results. Getting it right, even just slightly, is profoundly elating. To get these rewards more often, you break problems down, reducing them to soluble fragments. As you get into it, you appreciate the aesthetics of code creation: like equations, computer algorithms can be beautiful.

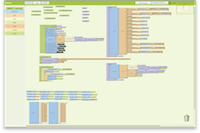
App Inventor blocks editorThe good news for me and other non-programmers is that it's never been faster or simpler to give programming a try. There are even some amazing tools to teach children and other novices the concepts of algorithms and procedures; MIT's Scratch project is a leader in that field. Some teaching tools, like the Lego MINDSTORMS robotics systems my daughter uses, and App Inventor for Android (right), are even capable of building robust, semi-scientific applications

Chances are good that you don't even need to install anything to get started. If you have a Mac or a Linux machine then you already have instant access to scripting-cum-programming languages like the shell, AWK, Perl and Python. There's even a multi-language interpreter online at codepad.org. These languages are very good places to start: you can solve simple problems with them very quickly and, once you've absorbed the basics, you'll use them every day. Start on AWK now and you'll be done by lunchtime tomorrow. 

For what's it's worth, here are a few tips I'd give anyone learning to program:

  • Don't do anything until you have a specific, not-too-hard problem to solve with a computer
  • If you can't think of anything, the awesome Project Euler has hundreds of problems to solve
  • Choose a high-level language like Python, Perl, or perhaps even Java; stay away from FORTRAN and C
  • Buy no more than one single book, preferably a thick one with a friendly title from O'Reilly
  • Don't do a course before you've tinkered on your own for a bit, but don't wait too long either (here's one)
  • Learn to really use Google: it's the fastest way to figure out what you want to do
  • Have fun brushing up on your math, especially trig, time series analysis, and inverse theory
  • Share what you build: help others learn and get more open

Bust out of the shackles of other people's software: learn to program!

Beyond the experts

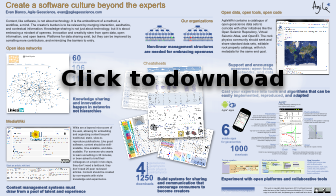
I presented a poster at the 1IWRP, and it was certainly a change in tone from the technical rigor of most other talks. Since I had a good discussion at the break with a number of people, I thought I would make a video out of it. If you've got six minutes, you can check it out:

In the video I make reference to a few other topics we've touched on earlier on the blog:

I hope to be getting into making more videos soon, so let me know if you like the format, and if you have any suggestions. 

Well worth showing off

Have you ever had difficulty displaying a well log in a presentation? Now, instead of cycling through slides, you can fluidly move across a digital, zoomable canvas using Prezi. I think it could be a powerful visual tool and presentation aid for geoscientists. Prezi allows users to to construct intuitive, animated visualizations, using size to denote emphasis or scale, and proximity to convey relevance. You navigate through the content simply by moving the field of view and zooming in and out through scale space. In geoscience, scale isn't just a concept for presentation design, it is a fundamental property that can now be properly tied-in and shown in a dynamic way.

I built this example to illustrate how geoscience images, spread across several orders of magnitude, can be traversed seamlessly for a better presentation. In a matter of seconds, one can navigate a complete petrophysical analysis, a raw FMI log, a segment of core, and thin section microscopy embedded at its true location. Explore heterogeniety and interpret geology with scale in context. How could you use a tool like this in your work?

Clicking on the play button will steer the viewer step by step through a predefined set of animations, but you can break off and roam around freely at any time (click and drag with your mouse, try it!). Prezi could be very handy for workshops, working meetings, or any place where it is appropriate to be transparent and thorough in your visualizations.

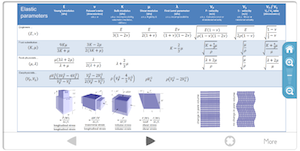
You can also try roaming Prezi by clicking on the image of this cheatsheet. Let us know what you think!

Thanks to Burns Cheadle for Prezi enthusiasm, and to Neil Watson for sharing the petrophysical analysis he built from public data in Alberta.

Can you do science on a phone?

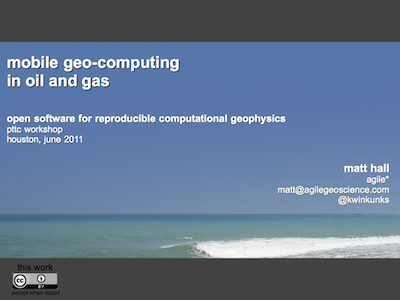
Mobile geo-computing presentationClick the image to download the PDF (3.5M) in a new window. The PDF includes slides and notes.Yes! Perhaps the real question should be: Would you want to? Isn't the very idea just an extension of the curse of mobility, never being away from your email, work, commitments? That's the glass half-empty view; it takes discipline to use your cellphone on your own terms, picking it up when it's convenient. And there's no doubt that sometimes it is convenient, like when your car breaks down, or you're out shopping for groceries and you can't remember if it was Winnie-the-Pooh or Disney Princess toothpaste you were supposed to get.

So smartphones are convenient. And everywhere. And most people seem to have a data plan or ready access to WiFi. And these devices are getting very powerful. So there's every reason to embrace the fact that these little computers will be around the office and lab, and get on with putting some handy, maybe even fun, geoscience on them. 

My talk, the last one of the meeting I blogged about last week, was a bit of an anomaly in the hardcore computational geophysics agenda. But maybe it was a nice digestif. You can read something resembling the talk by clicking on the image (above), or if you like, you can listen to me in this 13-minute video version:

So get involved, learn to program, or simply help and inspire a developer to build something awesome. Perhaps the next killer app for geologists, whatever that might be. What can you imagine...?

Just one small note to geoscience developers out there: we don't need any more seismographs or compass-clinometers!

More powertools, and a gobsmacking

Yesterday was the second day of the open geophysics software workshop I attended in Houston. After the first day (which I also wrote about), I already felt like there were a lot of great geophysical powertools to follow up on and ideas to chase up, but day two just kept adding to the pile. In fact, there might be two piles now.

First up, Nick Vlad from FusionGeo gave us another look at open source systems from a commercial processing shop's perspective. Along with Alex (on day 1) and Renée (later on), he gave plenty of evidence that open source is not only compatible with business, but it's good for business. FusionGeo firmly believe that no one package can support them exclusively, and showed us GeoPro, their proprietary framework for integrating SEPlib, SU, Madagascar, and CP Seis. 

SEP logoYang Zhang from Stanford then showed us how reproducibility is central to SEPlib (as it is to Madagascar). When possible, researchers in the Stanford Exploration Project build figures with makefiles, which can be run by anyone to easily reproduce the figure. When this is not possible, a figure is labelled as non-reproducible; if there are some dependencies, on data for example, then it is called conditionally reproducible. (For the geeks out there, the full system for implementing this involves SEPlib, GNU make, Vplot, LaTeX, and SCons). 

Next up was a reproducibility system with ancestry in SEPlib: Madagascar, presented by the inimitable Sergey Fomel. While casually downloading and compiling Madagascar, he described how it allows for quick regeneration of figures, even from other sources like Mathematica. There are some nice usability features of Madagascar: you can easily interface with processes using Python (as well as Java, among other languages), and tools like OpendTect and BotoSeis can even provide a semi-graphical interface. Sergey also mentioned the importance of a phenomenon called dissertation procrastination, and why grad students sometimes spend weeks writing amazing code:

"Building code gives you good feelings: you can build something powerful, and you make connections with the people who use it"

After the lunch break, Joe Dellinger from BP explained how he thought some basic interactivity could be added to Vplot, SEP's plotting utility. The goal would not be to build an all-singing, all-dancing graphics tool, but to incrementally improve Vplot to support editing labels, changing scales, and removing elements. A good goal for a 1-day hack-fest?

The show-stopper of the day was Bjorn Olofsson of SeaBird Exploration. I think it's fair to say that everyone was gobsmacked by his description of SeaSeis, a seismic processing system that he has built with his own bare hands. This was the first time he has presented the system, but he started the project in 2005 and open-sourced it about 18 months ago. Bjorn's creation stemmed from an understandable (to me) frustration with other packages' apparent complexity and unease-of-use. He has built enough geophysical algorithms for SeaBird to use the software at sea, but the real power is in his interactive viewing tools. Built with Java, Bjorn has successfully exploited all the modern GUI libraries at his disposal. Due to constraints on his time, the future is uncertain. Message of the day: Help this man!

Renée Bourque of dGB also opened a lot of eyes with her overview of OpendTect and the Open Seismic Repository. dGB's tools are modern, user-friendly, and flexible. I think many people present realized that these tools—if combined with the depth and breadth of more fundamental pieces like SU, SEPlib and Madagascar—could offer the possibility of a robust, well-supported, well-documented, and rich environment that processors can use every day, without needing a lot of systems support or hacking skills. The paradigm already exists: Madagascar has an interface in OpendTect today.

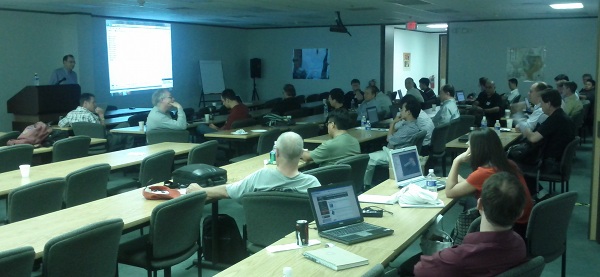
As the group began to start thinking about the weekend, it was left to me, Matt Hall, to see if there was any more appetite for hearing about geophysics and computers. There was! Just enough for me to tell everyone a bit about mobile devices, the Android operating system, and the App Inventor programming canvas. More on this next week!

It was an inspiring and thought-provoking workshop. Thank you to Karl Schleicher and Robert Newsham for organizing, and Cheers! to the new friends and acquaintances. My own impression was that the greatest challenge ahead for this group is not so much computational, but more about integration and consolidation. I'm looking forward to the next one!