
Are you a poet or a mathematician?
/ Many geologists can sometimes be rather prone to a little woolliness in their language. Perhaps because you cannot prove anything in geology (prove me wrong), or because everything we do is doused in interpretation, opinion and even bias, we like to beat about the bush. A lot.
Sometimes this doesn't matter much. We're just sparing our future self from a guilty binge of word-eating, and everyone understands what we mean—no harm done. But there are occasions when a measure of unambiguous precision is called for. When we might want to be careful about the technical meanings of words like approximately, significant, and certain.
Sherman Kent was a CIA analyst in the Cold War, and he tasked himself with bringing quantitative rigour to the language of intelligence reports. He struggled (and eventually failed), meeting what he called aesthetic opposition:
What slowed me up in the first instance was the firm and reasoned resistance of some of my colleagues. Quite figuratively I am going to call them the poets—as opposed to the mathematicians—in my circle of associates, and if the term conveys a modicum of disapprobation on my part, that is what I want it to do. Their attitude toward the problem of communication seems to be fundamentally defeatist. They appear to believe the most a writer can achieve when working in a speculative area of human affairs is communication in only the broadest general sense. If he gets the wrong message across or no message at all—well, that is life.
Sherman Kent, Words of Estimative Probability, CIA Studies in Intelligence, Fall 1964
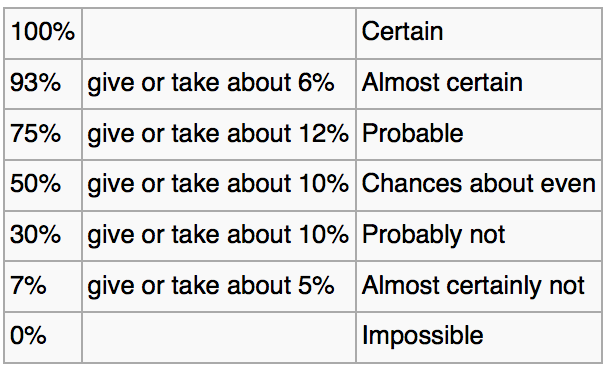 Kent proposed using some specific words to convey specific levels of certainty (right). We have used these words in our mobile app Risk*. The only modification I made was setting P = 0.99 for Certain, and P = 0.01 for Impossible (see my remark about proving things in geology).
There are other schemes. Most petroleum geologists know Peter Rose's work. A common language, with some quantitative meaning, can dull the pain of prospect risking sessions. Almost certainly. Probably.
Do you use systematic descriptions of uncertainty? Do you think they help? How can we balance our poetic side of geology with the mathematical?
As I was adding to the SubSurfWiki page for WEPs, I came across a wonderful article by Bernie O'Brien (1989), a physician. He interviewed 56 doctors about twenty-three words and phrases, asking them to place them on a probability scale. He then used the interquartile range of the responses as an indication of ambiguity. Here's how his data plot:
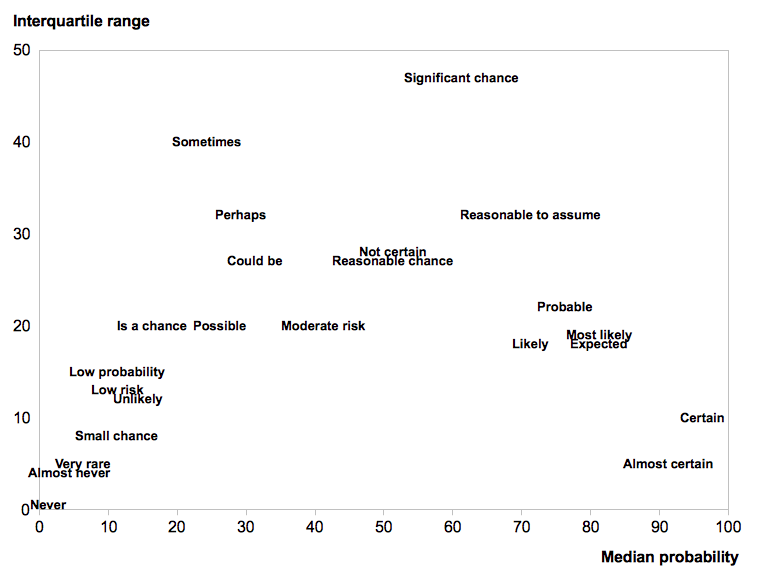
This is very interesting: words used to express equivocality and fence-sitting are themselves ambiguous and uncertain. That makes intuitive sense, but it's a fascinating insight into the language of uncertainty.
O'Brien also compared the interquartile range to a 3-point rating of ambiguity, as given by the respondents. You can read more about it on the wiki page.
Reference
O'Brien, B (1989), Words or numbers? The evaluation of probability expressions in general practice. Journal of the Royal College of General Practitioners 39, p 98–100, March 1989. Link to PDF.


 Except where noted, this content is licensed