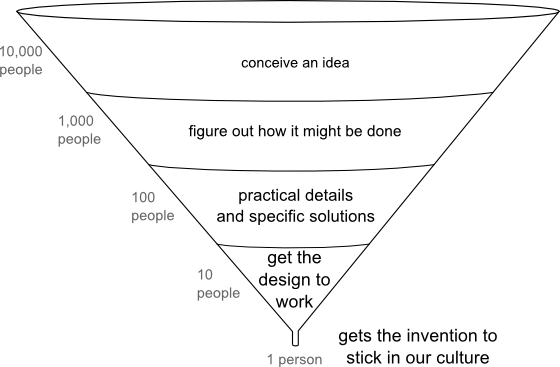
The simultaneity funnel

Is your brilliant idea really that valuable?

At Agile*, we don't really place a lot of emphasis on ideas. Ideas are abundant, ideas are cheap. Ideas mean nothing without actions. And it's impossible to act on every one. Funny though, I seem to get enthralled whenever I come up with a new idea. It's conflicting because, it seems to me at least, a person with ideas is more valuable, and more interesting, than one without. Perhaps it takes a person who is rich with ideas to be able to execute. Execution and delivery is rare, and valuable. 

Kevin Kelly describes the evolution of technology as a progression of the inevitable, quoting examples such as the lightbulb, and calculus. Throughout history parallel invention is the norm. 

We can say, the likelihood that the lightbulb will stick is 100 percent. The likelihood Edison's was the adopted bulb is, well, one in 10,000. Furthermore, each stage of the incarnation can recruit new people. Those toiling at the later stages may not have been among the early pioneers. Given the magnitude of the deduction, it is improbable that the first person to make an invention stick was also the first person to think of the idea.

Danny Hillis, founder of Applied Minds describes this as an inverted pyramid of invention. It tells us that your brilliant idea will have coparents. Even though the final design of the first marketable lightbulb could not have been anticipated by anyone, the concept itself was inevitable. All ideas start out abstract and become more specific toward their eventual execution. 

Does this mean that it takes 10,000 independant tinkerers to bring about an innovation? We aren't all working on the same problems at the same time, and some ideas arrive too early. One example is how microseismic monitoring of reservoir stimulation has exploded recently with the commercialization of shale gas projects in North America. The technology came from earthquake detection methods and that has been around for decades. Only recently has this idea been utilized in the petroleum industry, due to an alignment of compelling market forces. 

So is innovation merely a numbers game? Is 10,000 a critical mass that must be exceeded to bring about a single change? If so, the image of the lonely hero-inventor-genius, then, is misguided. And if it is a numbers game, then subsurface oil and gas technology could be seriously challenged. The SPE has nearly 100,000 members world wide, compared to our beloved SEG, which has a mere 6,000 33,000. Membership to a club or professional society does not equate to contribution, but if this figure is correct, I doubt our industry has the sustained man power to feed this funnel.

This system has been observed since the start of recorded science. The pace of invention is accelerating with population and knowledge growth. Additionally, even though the pace of technology is accelerating, so is specialization and diversification, which means we have fewer people working on more problems. Is knowledge sharing and crowd wisdom a natural supplement to this historical phenomenon? Are we augmenting this funnel or connecting disparate funnels when we embrace openess?

A crowded funnel might be compulsory for advacement and progression even if it is causes cutthroat competitiveness, hoarding, or dropping out altogether. But if these options become no longer palatable for the future of our industry, we will have to modify our approach.  

Wave-particle duality

Geoblogger Brian Romans has declared it Dune Week (here's part of his tweet), so I thought I'd jump on the bandwagon with one of my favourite dynamic dune examples illustrating the manifold controls on dune shape. 

Barchan dunes and parabolic dunes both form where there is limited sand supply and unimodally-directed wind (that is, the wind always blows from the same direction). Barchans, like these in Qatar, migrate downwind as sand is blown around the tips of the crescent. Consequently, the slip face is concave.

Location: 24.98°N, 51.37°E

In contrast, parabolic dunes have a convex slip face. They form in vegetated areas: vegetation causes drag on the arms of the crescent, resulting in the elongated shape. These low-amplitude dunes in NE Brazil have left obvious trails.

Location: 3.41°S, 39.00°W


The eastern edge of White Sands dunefield in New Mexico shows an interesting transition from barchan to parabolic, as the marginal vegetation is encroached upon by these weird gypsum dunes. The mode transition runs more or less north–south. Can you tell which side is which? Which way does the wind blow?

View Larger Map

Herrmann and Duràn modelled this type of transition, among others, in a series of fascinating papers including this presentation and Durán et al  2007, Parabolic dunes in north-eastern Brazil, in arXiv Soft Condensed Matter. Their figures show how their numerical models represent nature quite well as barchans transition to parabolic dunes:

Duran_Herrmann_2006_Dunes.png

News of the week

Newsworthy items of the last fortnight or so. We look for stories in the space between geoscience and technology, but if you come across anything you think we should cover, do tell

CNLOPB map of blocksNewfoundland blocks announced

Back in May we wrote about the offshore licensing round in Newfoundland and Labrador on Canada's Atlantic margin. The result was announced on Wednesday. There was no award on the northern blocks. The two parcels in northwest Newfoundland, in the Gulf of St Lawrence, were awarded to local outfit Ptarmigan Energy for a total work commitment of $2.002 million. The winning bids in the Flemish Pass area were won by a partnership of Statoil (at 50%), Chevron (40%) and Repsol (10%). The bids on these parcels were $202,171,394 and $145,603,270. Such arbitrary-looking numbers suggest that there was some characteristically detailed technical assessment going on at Statoil, or that a game theorist got to engineer the final bid. We'd love to know which. 

CanGeoRef for Canadian literature

CanGeoRef is a new effort to bring Canadian geoscience references in from the cold to the AGI's GeoRef bibliographic database. The Canadian Federation of Earth Sciences is coordinating the addition of literature from the Survey, various provincial and territorial agencies, as well as Canadian universities. Better yet, CanGeoRef has a 30-day free trial offer plus a 15% discount if you subscribe before December. 

In related news, the AGI has updated its famous Glossary of Geology, now in its 5th edition. We love the idea, but don't much like the $100 price tag. 

Tibbr at work

Tibbr logoTibbr is a social media engine for the enterprise, a sort of in-house Facebook. Launched in January by TIBCO, it's noteworthy because of TIBCO's experience; they're the company behind Spotfire among other things. It has some interesting features, like videocalling, voicemail integration and analytics (of course), that should differentiate it from competitors like Yammer. What these tools do for teamwork and integration is yet to be seen. 

The 3D world in 3D

Occasionally you see software you can't wait to get your hands on. When Ron Schott posted this video of some mud-cracks, we immediately started thinking of the possibilities for outcrops, hand specimens, SEM photography,... However, the new 123D Catch software from Autodesk only runs on Windows so Matt hasn't been able to test it yet. On the plus side, it's free, for now at least.

To continue the social media thread, Ron is very interested in its role in geoscience. He's an early adopter of Google+, so if you're interested in how these tools might help you, add him to one of your circles or hangout with him. As for us, we're still finding our way in G+.

This regular news feature is for information only. We aren't connected with any of these people or organizations, and don't necessarily endorse their products or services. Unless we say we think they're great.

Review: Communicating Rocks

Communicating Rocks by Peter Copeland
Pearson Education, July 2011, 160 pages

Visit Amazon.comI heard about this new book for geo-writers at the SEG Annual Meeting. I was there to teach a one-day course on technical writing for geoscientists, so naturally I ordered the book immediately. I've been leafing through it for about a month now and here's my verdict: I quite like it. Too wishy-washy? OK, I really like the contents. I really don't like the physical book. At all.

Why so bristly? Full disclosure: I love books. I know my recto from my verso, so to speak. Seeing a book typeset in Times and Arial makes me sad. Witnessing a publisher using the world's cheapest paper, flimsiest cardstock, and laughable page layout, I start to wonder if it's true what they say about the end of days for the medium. When they go on to charge $38 for such a book, I know it's true what they say about academic publishers gouging their customers.

None of this is author Peter Copeland's fault, and of course none of it really changes the message he wants to convey: writing matters. More particularly, your writing matters. Reading this short book, squarely aimed at and tailored for academic geoscientists, will make a difference to your writing. That's why it's on our recommended reading list.

I think it's fair to say that Copeland, a professor at the University of Houston, holds rather traditional views about writing. The first chapter, Communication equals thinking, is essentially a good-natured, 4000-word rant about the importance of writing well. He quotes the relatively tolerant George Orwell and the slightly-less-tolerant Lynne Truss, but gets quite worked up about the difference between forbid and prohibit, and sand and sandstone. I'm all for rigour and precision, but I do think there are contexts in which we can afford to write more comfortably, without feeling like we are programming a computer when we write. And I worry that would-be writers find it intimidating.

The second section of Copeland's book, Written communication, is the nub. After a look at types of writing, focusing pointedly on academic papers, there is a 65-page A-to-Z covering all sorts of topics from technical words to ordinary ones, and from points of English grammar to special geologic and scientific issues. One of the best passages is on accuracy, precision and repeatability; I will certainly refer to this section again. The section is rounded off with a useful collection of how-not-to examples, with clear and pertinent commentary—another dog-ear. 

Section three covers oral and poster presentations: more solid advice that, if taken, will lead the reader to be a fine presenter of observations, interpretations and ideas. But the advice is conventional and I do wonder if there's a missed opportunity to inspire, perhaps tacitly permit, the gifted communicator to take the risk of giving a remarkable presentation.

The final part of the book, aptly entitled Writing is hard, is another short piece about the graft of writing. Copeland celebrates the sheer hard work of planning to write, grinding out the first draft, and then writing the words all over again to make them the ones you really wanted. All excellent, practical, realistic advice for the grad student especially. 

Having accused Copeland of being a bit strict, I'll reveal myself to be a complete hypocrite by saying that I looked for several of my favourite peeves (i.e. and e.g., or the correct use of significant and begs the question) only to find them missing. And there is at least one slip: a billion is certainly no longer 10¹² in the UK. The 15 or so colour figures are generally quite weak, the math typesetting is poor, and the tables are grim. Stranger still, Copeland likes pie charts:

Pie charts are a fine way of displaying the relative amounts of several components.

Sacrilege! Or perhaps the very fact that all writing ranters have their own pet peeves means that they are nothing more than just peeves: silly predilections that don't really matter. 

H is for Horizon

Seismic interpretation is done by crafting, extracting, or digitally drawing horizons across data, but what is a horizon anyway? Coming up with a definition of horizon is hard. So I have narrowed it down to three.

Data-centric: a matrix of discrete samples in x,y,z that can be stored in a 3-column ASCII file. As such, a horizon is something that can be unambiguously drawn on a map, and treated like a raster image. Some software tools even call attribute maps horizons, blurring the definition further. The data-centric horizon is devoid of geology, and of geophysics; it is an artifact of software.

Geophysics-centric: an event, a reflection, in the seismic data; something you could pick with an automatic tracking tool. The quality is subject to the data itself. Change the data, or the processing, change the horizon. By this definition, a flat spot (a flattish reflection from a fluid contact) is a horizon, even though it's not stratigraphic. This type of horizon would be one of the inputs to instantaneous attribute analysis. The geophysics-centric horizon is still, in many ways, devoid of geology. It does not match your geological tops at the wells; it's not supposed to. 

Crossline 1241 (left), and geophysics-centric horizon (right) from the Penobscot 3D (Open Seismic Repository). Reds are highs and blues are lows.Geology-centric: a layer, a surface, an interface, in the earth, and its manifestation in the seismic data. It is the goal of seismic interpretation. In its purest form, it is unattainable: you can never know exactly where the horizon is in the subsurface. We do our best to construct it from wells, seismic, and imagination. Interestingly, because it is, to some degree, not consistent with the seismic reflections, it would not be possible to use the geology-centric horizon for instantaneous seismic attributes. It would match your well tops, if you could build it. But you can't. 

A four well model can help us illustrate this nuance. Geological tops have been correlated across these wells, and used as input to a seismic model to study the changes in thickness of the Bakken Formation (green to blue) interval.

Four-well synthetic seismic model illustrating how a geological surface (green, blue) is not necessarily the same as a seismic reflection. From Hall & Trouillot (2004).

The synthetic model shows how the seismic character changes from well to well. Notice that a stratigraphic surface is not the same thing as a seismic event. The top Bakken (BKKN) pick is a peak-to-trough zero-crossing in the middle, and pinches out and tunes at either end. The top Torquay (TRQY), transitions from a trough, to a zero-crossing, and then to another trough.

This uncertainty is part of the integration gap. It is why building a predictive geologic model is so difficult to do. The word horizon can be a catch-all term; reckless to throw around. Instead, clearly communicate the definition of your horizon pick, it will prevent confusion for yourself and for other people who come in contact with it.

REFERENCE
Hall, M & E Trouillot (2004). Predicting stratigraphy with spectral decomposition. Canadian Society of Exploration Geophysicists annual conference, Calgary, May 2004.

News of the week

This news feature has settled down into a fortnightly groove. News of the week sounds good, though, so we'll keep the name. Filtered geoscience tech news, every other Friday. Got tips?

Is it hot in here?

Google's philanthropic arm, Google.org, sponsored a major study at Southern Methodist University into the geothermal potential of the United States, and the results are in. This was interesting to us, because we've just spent a couple of weeks working our first geothermal project. Characterizing hot rocks is a fascinating and fairly new application of seismic technology, so it's been as much research exercise as interpretation project. From the looks of this beautiful map—which you must see in Google Earth—seismic may see wide application in the future. 

And the possibilties in Google Earth, along with Google SketchUp, for presenting geospatial data shouldn't go unnoticed!

CLAS arrives in OpendTect

A log analysis plug-in for dGB Earth Science's open-source integrated interpretation tool OpendTect was announced at EAGE conference earlier this year, and now it's available. The tool was developed by Geoinfo, a small Argentinian geoscience tech shop, in partnership with dGB. So now you can compute all your seismic petrophysics right in OpendTect.

On a sort-of-related note, Bert Bril, one of dGB's founders, just launched his blog, I can't believe it's not SCRUM, about agile software development. He even posts about geophysics. Yay!

Agile* apps

We're still regularly updating our completely free apps for Android. If you have an Android phone or tablet, go ahead and give them a spin. Volume* (right) is on version 3.1 already, and now does gas volumetrics, including Bg computation, and can grab any of the major crude oil benchmark prices for a quick-look value. And AVO* is just about to get a boost in functionality with an LMR plot; watch this space. Don't hold back if you've got requests. 

This regular news feature is for information only. We aren't connected with any of these people or organizations, and don't necessarily endorse their products or services. Unless we say we think they're great.

Please, sir, may I have some seismic petrophysics?

Petrophysics is an indispensible but odd corner of subsurface geoscience. I find it a bit of a paradox. On the one hand, well logs fill a critical gap between core and seismic. On the other hand, most organizations I've worked in are short of petrophysicists, sometimes—no, usually—without even recognizing it.

When a petrophysicist is involved in a project, they usually identify with the geologists, perhaps even calling themselves one. There’s a lot of concern for a good porosity curve, and the interpretation of the volume of clay and other mineralogical constituents. There’s also a lot of time for the reservoir engineer, who wants a reliable estimate of the reservoir pressure, temperature and water saturation (about 20–40% of the pore space is filled with water in an oil or gas field; it’s important to know how much). This is all good; these are important reservoir properties.

Incomplete and spiky logs in the uphole section of the Tunalik 1 well from the western edge of the National Petroleum Reserve in Alaska [click for larger image]. Image: USGSBut where is the geophysicist? Often, she is in her office, editing her own sonic log (called DT, the sonic is P-wave slowness), or QCing her own bulk density curve. Why? Because bulk density ρ and P-wave velocity VP together make the best estimate of acoustic impedance :

Acoustic impedance is the simplest way to compute a model seismic trace. We can compare this model trace to the real seismic data, recorded from the surface, to make the all-important connection between rocks and wiggles. The acoustic impedance curve determines what this model trace looks like, but we also need to know where it goes in the vertical travel-time domain. The sonic log comes into play again: it gives the best first estimate of seismic travel time. Since each sample is a measure of the time taken for a sound wave to travel the unit distance, it can be integrated for the total travel time. Yeah, that’s mathematics. It works.

In short, the logs are critical for doing any geophysics at all.

But they always need attention. Before we can use these logs, they must be quality checked and often edited. There is often a need to splice data form various logging runs together. The uphole sections are usually bad (there may be measurements in cased intervals, for example). Both of the logs are sensitive to hole condition. 

So the logs are critical, and always need fine-tuning. But I have yet to work on a project where a clean, top-to-tail DT and RHOB log are seen as a priority. Usually, they are not even on the List Of Things To Do. 

Result: the geophysicist gets on with it, and edits the logs. Now there's a DT_EDIT curve in the project. Oh, that name's been taken. And DT_Final and DT_edit2. I wonder who made those? DT_Matt then... but will anyone know what that is? No, and no-one will care either, because the madness will never end. 

There is even the risk of a greater tragedy: no geophysical logs at all. A missing or incomplete sonic because the tool was never run, or it failed and was not repeated, or it was just forgotten. No shear-wave sonic when you really just need a shear-wave sonic. No checkshots anywhere in the entire field, or the unedited data have been loaded in some horrible way. No VSPs anywhere, or no-one knows where the data are. Probably rotting on a 9-track tape somewhere in a salt cavern in Louisiana. 

Here's are some things to ask your friendly petrophysicist for:

  • A single, lightly edited, RHOB, DT, and DTS (if available) curve, from the top of the reliable data to the bottom.
  • If they're available, a set of checkshots with time and depth measured from the seismic datum (they are almost never recorded this way so have to be corrected).
  • Help understanding the controls on sonic and density with depth; for example, can we ascribe some portion of the trends to compaction, and some to diagenesis?
  • Help understanding the relationship between lithology and acoustic impedance. Filter the data to see how the impedance of sands and shales vary with depth.
  • If there are several wells with complete sets of logs and there's to be an attempt to model missing or incomplete logs, then the petrophysicist should be involved.

What have I missed? Is there more? Or maybe you think this is too much?

Last thing: when the petrophysicist is making his beautiful composite displays of the well data, ask him to include acoustic impedance, the reflection coefficients, the synthetic seismogram, and even the seismic traces from the well location. This will surprise people. In a good way.

Thin-bed vowels and heterolithic consonants

Seismologists see the world differently. Or, rather, they hear the world differently. Sounds become time series, musical notes become Fourier components. The notes we make with our vocal chords come from the so-called sonorants, especially the vowel sounds, and they look like this:

Consontants aren't as pretty, consisting of various obstruents like plosives and fricatives—these depend on turbulence, and don't involve the vocal chords. They look very different:

Geophysicists will recognize these two time series as being signal-dominated and noise-dominated, respectively. The signal in the vowel sound is highly periodic: a small segment about 12 ms long is repeated four times in this plot. There is no repeating signal in the consonant sound: it is more or less white noise.

When quantitative people hear the word periodic, their first thought is usually Fourier transform. Like a prism, the Fourier transform unpacks mixed signals into monotones, making them easier to examine and explain. For instance, the Fourier transform of a set of limestone beds might reveal the Milankovitch cycles of which I am so fond. What about S and E?

The spectrum of the consonant S is not very organized and close to being random. But the E sound has an interesting shape. It's quite smooth and has obvious repetitive notches. Any geophysicist who has worked with spectral decomposition—a technique for investigating thin beds—will recognize these. For example, compare the spectrums for a random set of reflection coefficients (what we might call background geology) and a single thin bed, 10 ms thick:

Notches! The beauty of this, from an interpreter's point of view, is that one can deduce the thickness of the thin-bed giving rise to this notchy spectrum. The thickness is simply 1/n, where n is the notch spacing, 100 Hz in this case. So the thickness is 1/100 = 0.01 s = 10 ms. We can easily compute the spectrum of seismic data, so this is potentially powerful.

While obvious here, in a complicated spectrum the notches might be hard to detect and thus measure. But the notches are periodic. And what do we use to find periodic signals? The Fourier transform! So what happens if we take the spectrum of the spectrum of my voice signal—where we saw a 12 ms repeating pattern?

There's the 12 ms periodic signal from the time series! 

The spectrum of the spectrum is called the cepstrum (pronounced, and sometimes spelled, kepstrum). We have been transported from the frequency domain to a new universe: the quefrency domain. We are back with units of time, but there are other features of the cepstral world that make it quite different from the time domain. I'll discuss those in a future post. 

Based on a poster paper I presented at the 2005 EAGE Conference & Exhibition in Madrid, Spain, and on a follow-up article Hall, M (2006), Predicting bed thickness with cepstral decomposition, The Leading Edge, February 2006, doi:10.1190/1.2172313

News of the week

Help us stay on top of the latest and greatest: if you hear about something that might make geophysics even awesomer for all of us, drop us a line! In the meantime, here's some news that caught our attention...

Free software goodness

Innovative Australian software shop DownUnder GeoSolutions, aka DUG, is now offering DUG Insight to students for free! As if one amazing free (as in beer) seismic visualization and interpretation tool wasn't enough—you do have OpendTect, right?—now there's another. Just email them a copy of your student ID, and they'll get you started. 

NEWSFLASH  Hard-up students might also like this: Nature Geoscience for $10 a year! 

S-ray vision

OK, it doesn't sound quite as cool as X-ray vision, but S-band microwaves really can see through walls. Sort of. Boffins at MIT demonstrate their claims in this video... it's not geophysics, but another hard inverse imaging problem.

Petrophysics for Dummies

Occasionally while wandering lost in the interweb you stumble on gold. This is gold. Graham Davies was a geoscientist at Enterprise Oil, the plucky British independent exploration company I did my first internship at. He's been recording petrophysics tutorials, and they're 100% brilliant. "Even if you've never heard of petrophysics before," claims Davis.

What the heck is the geoblogosphere?

Not really a geotechnical story, but some readers might be interested to know more about geoscience blogs. A recent research paper, Geißler et al 2011, is a good place to start. The authors, who include übergeoblogger Callan Bentley of the structural geology blog Mountain Beltway, do a terrific job of exploraing the reasons for blogging, the perceptions of employers and supervisors, and every other angle you can think of. 

NEWSFLASH The 315th Where on (Google) Earth geomorphological puzzle went unsolved for 11 days, but was finally solved this morning. Congratulations to Ron Schott, the next episode is yours to host.

This regular news feature is for information only. We aren't connected with any of these people or organizations, and don't necessarily endorse their products or services. 

McKelvey's reserves and resources

Vincent McKelvey (right) was chief geologist at the US Geological Survey, and then its director from 1971 until 1977. Rather like Sherman Kent at the CIA, who I wrote about last week, one of his battles was against ambiguity in communication. But rather than worrying about the threat posed by the Soviet Union or North Korea, his concern was the reporting of natural resources in the subsurface of the earth. Today McKelvey's name is associated with a simple device for visualizing levels of uncertainty and risk associated with mineral resources: the McKelvey box.

Here (left) is a modernized version. It helps unravel some oft-heard jargon. The basic idea is that only discovered, commercially-viable deposits get to be called Reserves. Discovered but sub-commercial (with today's technology and pricing) are contingent resources. Potentially producible and viable deposits that we've not yet found are called prospective resources. These are important distinctions, especially if you are a public company or a government.

Over time, this device has been reorganized and subdivided with ever more subtle distinctions and definitions. I was uninspired by the slightly fuzzy graphics in the ongoing multi-part review of reserve reporting in the CSPG Reservoir magazine (Yeo and Derochie, 2011, Reserves and resources series, CSPG Reservoir, starting August 2011). So I decided to draw my own version. To reflect the possiblity that there may yet be undreamt-of plays out there, I added a category for Unimagined resources. One for the dreamers.

You can find the Scalable Vector Graphics file for this figure in SubSurfWiki. If you have ideas about other jargon to add, or ways to represent the uncertainty, please have a go at editing the wiki page, the figure, or drop us a line!