Six books about seismic interpretation

Last autumn Brian Romans asked about books on seismic interpretation. It made me realize two things: (1) there are loads of them out there, and (2) I hadn't read any of them. (I don't know what sort of light this confession casts on me as a seismic interpreter, but let's put that to one side for now.)

Here are the books I know about, in no particular order. Have I missed any? Let us know in the comments!

Introduction to Seismic Interpretation

AAPG
Amazon.com
Google Books

Bruce Hart, 2011, AAPG Discovery Series 16. Tulsa, USA: AAPG. List price USD 42.

This 'book' is a CD-based e-book, aimed at the new interpreter. Bruce is an interpreter geologist, so there's plenty of seismic stratigraphy.

A Petroleum Geologist's Guide to Seismic Reflection

William Ashcroft, 2011. Chichester, UK: Wiley-Blackwell. List price USD 90.

I really, really like this book. It covers all the important topics and is not afraid to get quantitative — and it comes with a CD containing data and software to play with. 

Interpretation of Three-Dimensional Seismic Data

Alistair Brown, AAPG Memoir. Tulsa, USA: AAPG. List price USD 115.

This book is big! Many people think of it as 'the' book on interpretation. The images are rather dated—the first edition was in 1986—but the advice is solid.

First Steps in Seismic Interpretation

SEG
Amazon.com
Google Books

Donald Herron, SEG. Tulsa, USA: SEG. List price USD 62.

This new book is tremendous, if a little pricey for its size. Don is a thoroughly geophysical interpreter with deep practical experience. A must-read for sub-salt pickers!

3D Seismic Interpretation

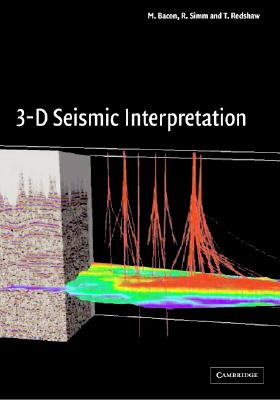
Bacon, Simm and Redshaw, 2003. Cambridge, UK: Cambridge. List price USD 80.

A nicely produced and comprehensive treatment with plenty of quantitative meat. Multi-author volumes seem a good idea for such a broad topic.

Elements of 3D Seismology

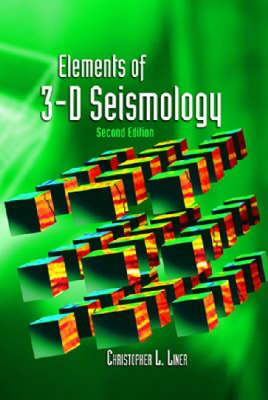
Chris Liner, 2004. Tulsa, USA: PennWell Publishing. List price USD 129.

Chris Liner's book and CD are not about seismic interpretation, but would make a good companion to any of the more geologically inclined books here. Fairly hardcore.

The rest and the next

Out-of-print and old books, or ones that are less particularly about seismic interpretation:

An exciting new addition will be the forthcoming book from Wiley by Duncan Irving, Richard Davies, Mads Huuse, Chris Jackson, Simon Stewart and Ralph Daber — Seismic Interpretation: A Practical Approach. Look out for that one in 2014.

Watch out for our book reviews on all these books in the coming weeks and months.
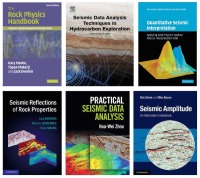
The HUB on the South Shore

One of the things we dream about is a vibrant start-up community in the energy sector. A sort of Silicon Valley, but in the Bow Valley, or the Woodlands, or wherever. And focused on the hard, important problems in our field. More young people bringing their ideas, energy and talent — and more experienced people taking a chance, investing, and mentoring. Wresting more of the innovation opportunity back from big E&P and service companies, and freeing the professionals trapped in them.

We also want to see some of this in Nova Scotia. Indeed, the future of the Nova Scotian economy depends on it. So Agile has invested in a new community catalyst on the South Shore, the region where I live. Along with two others, I have renovated an old school room (left) and started The HUB South Shore — a place where freelancers, entrepreneurs, and professionals can come to work, network, not work, and learn. Affiliated with the HUB Halifax that Evan frequents, it's part of a global coworking movement, and a far-reaching network of HUBs.

Most importantly, it's a place to be around other highly productive, creative individuals — all of whom have made bold choices in their careers. Their proximity gives us all greater courage.  

There are similar spaces in Calgary, Houston, Aberdeen, and Perth. They completely transform the experience of working alone, or in small groups like Agile. Instead of isolation, you gain instant access to other self-starters, potential colleagues, and new friends. Many of these spaces are de facto incubators, with ready access to tools, people, and even financial backing. They are places where things happen — without IT, HR, or Legal. Imagine!

If you're thinking about starting out on your own, or with a friend or three, look around for a co-working space. It might make the transition from employee to freelancer (or even employer) a little less daunting. 

And if you find yourself on the South Shore of Nova Scotia, come to the HUB and say hello!

The calculus of geology

Calculus is the tool for studying things that change. Even so, in the midst of the dynamic and heterogeneous earth, calculus is an under-practised and, around the water-cooler at least, under-celebrated workhorse. Maybe that's because people don't realize it's all around us. Let's change that. 

Derivatives of duration

We can plot the time f(x) that passes as a seismic wave travels though space x. This function is known to many geophysicists as the time-to-depth function. It is key for converting borehole measurements, effectively recorded using a measuring tape, to seismic measurements, recorded using a stop watch.

Now let's take the derivative of f(x) with repsect to x. The result is the slowness function (the reciprocal of interval velocity):

The time duration that a seismic wave travels over a small interval (one metre). This function is an actual sonic well log. Differentiating once again yields this curious spiky function:

Geophysicists will spot that this resembles a reflection coefficient series, which governs seismic amplitudes. This is actually a transmission coefficient function, but that small detail is beside the point. In this example, the creating a synthetic seismogram mimics the calculus of geology. 

If you are familiar with the integrated trace attribute, you will recognize that it is an attempt to compute geology by integrating reflectivity spikes. The only issue in this case, and it is a major issue, is that the seismic trace is bandlimited. It does not contain all the information about the earth's slowness. So the earth's geology remains elusive and blurry.

The derivative of slowness yields the reflection boundaries, the integral of slowness yields their position. So in geophysics speak, I wonder, is forward modeling akin to differentiation, and inverse modeling akin to integration? I find it fascinating that these three functions have essentially the same density of information, yet they look increasingly complicated when we take derivatives. 

What other functions do you come across that might benefit from the calculus treatment?

The sonic log used in this example is from the O-32-B/11-E-64 well onshore Nova Scotia, which is publically available but not easily accessible online.

Creeping inefficiency

Dear CIO of a major oil and gas company,

Search—something you take for granted on the Internet—is broken in your company. Ask anyone.

You don't notice, because you don't count the cost of lost seconds or minutes finding things. And you can't count the cost of the missed opportunities because someone gave up looking. This happens thousands of times a day, by the way. 

Here's what people do when they want to find something on your intranet: 

  1. Ask people if they know where it is. (Nobody does.)
  2. Give up.

The good news is that there is a relatively easy way to fix this immediately and forever. Here's how:

  1. Buy Google Search Appliance.

If you don't already have one of these in your server room, then your luck is in. Soon everyone will think you're a hero. At least, they will until they realize there are 31 versions of every file in your organization. At least you'll know where they all are though, right?

You're welcome,
Matt

Review: The Wave Watcher's Companion

Visit Amazon.com

The Wave Watcher's Companion: From Ocean Waves to Light Waves via Shock Waves, Stadium Waves, and All the Rest of Life's Undulations
Gavin Pretor-Pinney, Perigee (USA), Bloomsbury (UK), July 2010, $22.95

This book was on my reading list, and then on my shelf, for ages. Now I wish I'd snapped it up and read it immediately. In my defence, the end of 2010 was a busy time for me, what with turning my career upside down and everything, but I'm sure there's a lesson there somewhere...

If you think of yourself as a geophysicist, stop reading this review and buy this book immediately. 

OK, now they've gone, we can look more closely. Gavin Pretor-Pinney is the chap behind The Cloud Appreciation Society, the author of The Cloudspotter's Guide, and co-creator of The Idler Magazine. He not a scientist, but a witty writer with a high curiosity index. The book reads like an extended blog post, or a chat in the pub. A really geeky chat. 

Geophysicists are naturally drawn to all things wavy, but the book touches on sedimentology too — from dunes to tsunamis to seiches. Indeed, the author prods at some interesting questions about what exactly waves are, and whether bedforms like dunes (right) qualify as waves or not. According to Andreas Baas, "it all depends on how loose is your definition of a wave." Pretor-Pinney likes to connect all possible dots, so he settles for a loose definition, backing it up with comparisons to tanks and traffic jams. 

The most eye-opening part for me was Chapter 6, The Fifth Wave, about shock waves. I never knew that there's a whole class of waves that don't obey the normal rules of wave motion: they don't obey the speed limits, they don't reflect or refract properly, and they can't even be bothered to interfere like normal (that is, linear) waves. Just one of those moments when you realize that everything you think you know is actually a gross simplification. I love those moments.

The book is a little light on explanation. Quite a few of the more interesting parts end a little abruptly with something like, "weird, huh?". But there are plenty of notes for keeners to follow up on, and the upside is the jaunty pace and adventurous mix of examples. This one goes on my 're-read some day' shelf. (I don't re-read books, but it's the thought that counts).

Figure excerpt from Pretor-Pinney's book, copyright of the author and Penguin Publishing USA. Considered fair use.

Interpreting spectral gamma-ray logs

Before you can start interpreting spectral gamma-ray logs (or, indeed, any kind of data), you need to ask about quality.

Calibrate your tool...

The main issues affecting the quality of the logs are tool calibration and drilling mud composition. I think there's a tendency to assume that delivered logs have been rigorously quality checked, but... they haven't. The only safe assumption is that nobody cares about your logs as much as you. (There is a huge opportunity for service companies here — but in my experience they tend to be focused on speed and quantity, not quality.)

Calibration is critical. The measurement device in the tool consists of a thallium-laced NaI crystal and a photomultiplier. Both of these components are sensitive to temperature, so calibration is especially important when the temperature of the tool is changing often. If the surface temperature is very different from the downhole—winter in Canada—calibrate often.

Drilling mud containing KCl (to improve borehole stability) increases the apparent potassium content of the formation, while barite acts as a gamma-ray absorber and reduces the count rates, especially in the low energies (potassium).

One of the key quality control indicators is negative readings on the uranium log. A few negative values are normal, but many zero-crossings may indicate that the tool was improperly calibrated. It is imperative to quality control all of the logs, for bad readings and pick-up effects, before doing any quantitative work.

...and your interpretation

Most interpretations of spectral-gamma ray logs focus on the relationships between the three elemental concentrations. In particular, Th/K and Th/U are often used for petrophysical interpretation and log correlation. In calculating these ratios, Schlumberger uses the following cut-offs: if uranium < 0.5 then uranium = 0.5; if potassium < 0.004 then potassium = 0.001 (according to my reference manual for the natural gamma tool).

In general, high K values may be caused by the presence of potassium feldspars or micas. Glauconite usually produces a spike in the K log. High Th values may be associated with the presence of heavy minerals, particularly in channel deposits. Increased Th values may also be associated with an increased input of terrigenous clays. Increases in U are frequently associated with the presence of organic matter. For example, according to the ODP, particularly high U concentrations (> 5 ppm) and low Th/U ratios (< 2) often occur in black shale deposits.

The logs here, from Kansas Geological Survey open file 90-27 by Macfarlane et al. shows a quite overt interpretive approach, with the Th/K log labelled with minerals (feldspar, mica, illite–smectite) and the Th/U log in uranium 'fixedness', a proxy for organic matter.

Sounds useful. But really, you can probably find just a paper to support just about any interpretation you want to make. Which isn't to say that spectral gamma-ray is no use — it's just not diagnostic on its own. You need to calibrate it to your own basin and your own stratigraphy. This means careful, preferably quantitative, comparison of core and logs. 

Further reading 

What is spectral gamma-ray?

The spectral gamma-ray log is a measure of the natural radiation in rocks. The amplitude of the signal from the gamma-ray tool, which is just a sensor with no active source, is proportional to the energy of the gamma-ray photons it encounters. Being able to differentiate between photons of different energies turns out to be very handy Compared to the ordinary gamma-ray log, which ignores the energies and only counts the photons, it's like seeing in colour instead of black and white.

Why do we care about gamma radiation?

First, what are gamma rays? Highly energetic photons: electromagnetic radiation with very short wavelengths. 

Being able to see different energies, or 'colours', means we can differentiate between the radioactive decay of different elements. Elements decay by radiating energy, and the 'colour' of that energy is characteristic of that element (actually, of each isotope). So, we can tell by looking at the energy of a photon if we are seeing a potassium atom (40K) or a uranium atom (238U) decay. These are very different isotopes, with very different habits. We can do geology!

In fact, all sorts of radioisotopes occur naturally in the earth. By far the most abundant are potassium 40K, thorium 232Th and uranium 238U. Of these, potassium is the most abundant in sedimentary rocks, but thorium and uranium are present in small quantities, and have particular sedimentological implications.

What exactly are we measuring?

Potassium 40K decays to argon about 10% of the time, with γ-emission at 1.46 MeV (the other 90% of the time it decays to calcium). However, all of the decay in the 232Th and 238U decay series occurs by α- and β-particle decay, which don't always result in photon emission. The tool in fact measures γ-radiation from the decay of thallium 208Tl in the 232Th series (right), and from bismuth 214Bi in the 238U series. The spectral gamma-ray tool must be calibrated to known samples to give concentrations of 232Th and 238U from its readings. Proper calibration is vital, and is temperature-sensitive (of note in Canada!).

The concentrations of the three elements are estimated from the spectral measure­ments. The concentration of potassium is usually measured in percent (%) or per mil (‰), or sometimes in kilograms per tonne, which is equivalent to per mil. The other two elements are measured in parts per million (ppm).

Here is the gamma-ray spectrum from a single sample from 509 m below the sea-floor at ODP Site 1201. The final spectrum (heavy black line) is shown after removing the background spectrum (gray region) and applying a three-point mean boxcar filter. The thin black line shows the raw spectrum. Vertical lines mark the interval boundaries defined by Peter Blum (an ODP scientist at Texas A&M). Prominent energy peaks relating to certain elements are identified at the top of the figure. The inset shows the spectrum for energies >1500 keV at an expanded scale. 

We wouldn't normally look at these spectra. Instead, the tool provides logs for K, Th, and U. Next time, I'll look at the logs.

Spectrum illustration by Wikipedia user Inductiveload, licensed GFDL; decay chain by Wikipedia user BatesIsBack, licensed CC-BY-SA.

Machines can read too

The energy industry has a lot of catching up to do. Humanity is faced with difficult, pressing problems in energy production and usage, yet our industry remains as secretive and proprietary as ever. One rich source of innovation we are seriously under-utilizing is the Internet. You have probably heard of it.

Machine experience design

semantic.jpg

Web sites are just the front-end of the web. Humans have particular needs when they read web pages — attractive design, clear navigation, etc. These needs are researched and described by the rapidly growing field of user experience design, often called UX. (Yes, the ways in which your intranet pages need fixing are well understood, just not by your IT department!)

But the web has a back-end too. Rather than being for human readers, the back-end is for machines. Just like human readers, machines—other computers—also have particular needs: structured data, and a way to make queries. Why do machines need to read the web? Because the web is full of data, and data makes the world go round. 

So website administrators need to think about machine experience design too. As well as providing beautiful web pages for humans to read, they should provide widely-accepted machine-readable format such as JSON or XML, and a way to make queries.

What can we do with the machine-readable web?

The beauty of the machine-readable web, sometimes called the semantic web, or Web 3.0, is that developers can build meta-services on it. For example, a website like hipmunk.com that finds the best flights, wherever they are. Or a service that provides charts, given some data or a function. Or a mobile app that knows where to get the oil price. 

In the machine-readable web, you could do things like:

  • Write a program to analyse bibliographic data from SEG, SPE and AAPG.
  • Build a mobile app to grab log mnemonics info from SLB's, HAL's, and BHI's catalogs.
  • Grab course info from AAPG, PetroSkills, and Nautilus to help people find training they need.

Most wikis have a public application programming interface, giving direct, machine-friendly access to the wiki's database. Here are two views of one wiki page — click on the images to see the pages:

At SEG last year, I suggested to a course provider that they might consider offering machine access to their course catalog—so that developers can build services that use their course information and thus send them more students. They said, "Don't worry, we're building better search tools for our users." Sigh.

In this industry, everyone wants to own their own portal, and tends to be selfish about their data and their users. The problem is that you don't know who your users are, or rather who they could be. You don't know what they will want to do with your data. If you let them, they might create unimagined value for you—as hipmunk.com does for airlines with reasonable prices, good schedules, and in-flight Wi-Fi. 

I can't wait for the Internet revolution to hit this industry. I just hope I'm still alive.

Dream geoscience courses

MOOCs mean it's never been easier to learn something new.This is an appeal for opinions. Please share your experiences and points of view in the comments.

Are you planning to take any technical courses this year? Are you satisfied with the range of courses offered by your company, or the technical societies, or the commercial training houses (PetroSkills, Nautilus, and so on)? And how do you choose which ones to take — do you just pick what you fancy, seek recommendations, or simply aim for field classes at low latitudes?

At the end of 2012, several geobloggers wrote about courses they'd like to take. Some of them sounded excellent to me too... which of these would you take a week off work for?

Here's my own list, complete with instructors. It includes some of the same themes...

  • Programming for geoscientists (learn to program!) — Eric Jones
  • Solving hard problems about the earth — hm, that's a tough one... Bill Goodway?
  • Communicating rocks online — Brian Romans or Maitri Erwin
  • Data-driven graphics in geoscience — the figure editor at Nature Geoscience
  • Mathematics clinic for geoscientists — Brian Russell
  • Becoming a GIS ninja — er, a GIS ninja
  • Working for yourself — needs multiple points of view
What do you think? What's your dream course? Who would teach it?

Making images or making prospects?

Well-rounded geophysicists will have experience in each of the following three areas: acquisition, processing, and interpretation. Generally speaking, these three areas make up the seismic method, each requiring highly specified knowledge and tools. Historically, energy companies used to control the entire spectrum, owning the technology, the know-how and the risk, but that is no longer the case. Now, service companies do the acquisition and the processing. Interpretation is largely hosted within E & P companies, the ones who buy land and drill wells. Not only has it become unreasonable for a single geophysicist to be proficient across the board, but organizational structures constrain any particular technical viewpoint. 

Aligning with the industry's strategy, if you are a geophysicist, you likely fall into one of two camps: those who make images, or those who make prospects. One set of people to make the data, one set of people to do the interpretation.

This seems very un-scientific to me.

Where does science fit in?

Science, the standard approach of rational inquiry and accruing knowledge, is largely vacant from the applied geophysical business landscape. But, when science is used as a model, making images and making prospects are inseperable.

Can applied geophysics use scientific behaviour as a central anchor across disciplines?

There is a significant amount of science that is needed in the way that we produce observations, in the way that we make images. But the business landscape built on linear procedures leaves no wiggle room for additional testing and refinement. How do processors get better if they don't hear about their results? As a way of compensating, processing has deflected away from being a science of questioning, testing, and analysis, and moved more towards, well,... a process.

The sure-fire way to build knowledge and decrease uncertainty, is through experimentation and testing. In this sense this notion of selling 'solutions', is incompatible with scientific behavior. Science doesn't claim to give solutions, science doesn't claim to give answers, but it does promise to address uncertainty; to tell you what you know.

In studying the earth, we have to accept a lack of clarity in our data, but we must not accept mistakes, errors, or mediocrity due to shortcomings in our shared methodologies.

We need a new balance. We need more connectors across these organizational and disciplinary divides. That's where value will be made as industry encounters increasingly tougher problems. Will you be a connector? Will you be a subscriber to science?

Hall, M (2012). Do you know what you think you know? CSEG Recorder 37 (2), February 2012, p 26–30. Free to download from CSEG.