Make some geophysics!

Last month we announced the Geophysics Hackathon. It's one month away today, so I thought I'd post a quick update with the latest developments.

First: good news. The event will be completely free to attend.

Second, I wanted to clear something up. The hackathon is not about hacking, as in gaining illicit access to other people's computers. That would be bad. Today, 'hacking' has reverted to its original MIT meaning, and tends to mean rapid prototyping and tool creation — playing! — with software, with hardware, or with life in general

START Houston

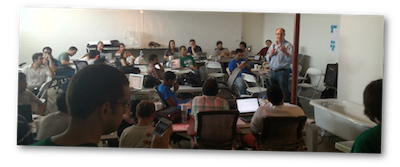
We'll be camped out at START Houston, a progressive co-working and incubation space in the East Downtown area of Houston. This is exciting because START is plugged right in to the most innovative, fast-moving, energetic people in Houston. Some of them even work in the energy business! 

What you can hack

You can come to the hackathon and do anything you like — closed or open source, on your own or in a team, web or mobile or desktop or mainframe. But we are holding a contest, for those that are interested. The contest has some rules. But the first rule of the day is, you don't have to enter the contest. If you prefer, just come and learn something new — I will be there to get you started. Stuck for ideas? There are loads on the wiki page.

Prizes

I'm rather excited about the prizes. I don't want to let the cat completely out of the bag, but we have some Nexus 7 tablets to give away, some Raspberry Pi kits, lots of must-read books, and several years' worth of access to MyBalsamiq — a cloud-based user-interface design tool.

Huge thanks to Enthought and Balsamiq for helping to make all this awesome happen.

Join us! Sign up...

As of right now, there are 16 people coming to the two days. Can you help us get to 25? Send this post to someone you know would be into it... and come along yourself. If you know geophysics or seismic interpretation, or you have a good head for business, or you like math and stats, or you know how to code — you'll fit right in. See you there!

First appearance datum at Green Point

Armed with the Geologic Field Guide of Newfoundland, last week I ventured to one of the most intensely scrutinized outcrops in the world. Green Point in Gros Morne National Park provides continuous exposure to more than 30 million years of sediment accumulation in the Iapetus ocean. The rocks formed in deep water near the base of the ancient continental slope. It was awesome and humbling.

In January 2000, the International Union of Geological Sciences designated Green Point as a Global Stratotype Section and Point (GSSP). That's an official international reference point for the geologic time scale. I learned after the fact that there are only a handful of these in North America.

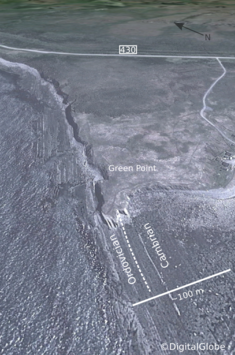
Researchers and students at Memorial University and elsewhere studied more than 10,000 fossils from Green Point, using tiny conodonts and delicate graptolites to locate the boundary between the Cambrian and Ordovician periods, 488 Ma in the past. They have narrowed it down to a single layer, Bed 23, that contains the first appearance of the conodant species, Iapetognathus fluctivagus.

To the best of my estimatation, I have indicated the location of Bed 23 with the white dashed line in the figure to the right, and with the pointing figure of my *ahem* geologic scale marker in the photograph below.

Snapshots from the Outcrop

Being the massive natural exhibition that it is, there are likely volumes of things to observe and measure at Green Point. I had no agenda whatsoever, but here are four observations that caught my interest:

  1. Cavities from core plugs at regularly spaced intervals. Each piece taken and studied as part of an international scientific experiment, aimed at accurately identifying major turning points in earth's history. 
  2. Small scale fault with some antithetic joints reminiscent of some artifacts I have seen on seismic.
  3. and 4. A faulted limestone conglomerate bed. Shown from two different points of view. I am increasingly curious about the nature of the aperture of deformation zones. Such formidable forces, such a narrow region of strain.

I left with a feeling that I am sure is felt by most geologists leaving a site of extreme interest. Did I make enough observations? Did I collect enough data? I wish I had a GigaPan, or maybe portable LiDAR station. I feel reconnected to the vastness of scales over which earth processes occur, and the heterogeneity caused by well-understood systems playing out over inconceivable expanses of time. 

I'd like to flip the outcrop 120° counterclockwise, and build another stupid seismic model. What could mathematicians, programmers, and geoscientists do at this outcrop? A digital playground for integration awaits.

July linkfest

It's another linkfest! All the good stuff from our newsfeed over the last few weeks.

We mentioned the $99 supercomputer in April. The Adapteva Parellella is a bit like a Raspberry Pi, but with the added benefit of a 16- or 64-core coprocessor. The machines are now shipping, and a version is available for pre-order.

In April we also mentioned the University of Queensland's long-running pitch drop experiment. But on 18 July a drop fell from another similar experiment, but which has even slower drops...

A gem from history:

In the British Islands alone, twice as much oil as the navy used last year could be produced from shale. — Winston Churchill, July 1913.

This surprising quote was doing the rounds last week (I saw it on oilit.com), but of course Churchill was not fortelling hydraulic fracturing and the shale gas boom; he was talking about shale oil. But it's still Quite Interesting.

Chris Liner's blog is more than quite interesting — and the last two posts have been especially excellent. The first is a great tutorial video describing a semi-automatic rock volume estimation workflow. You can get grain size and shape data from the same tool (tip: FIJI is the same but slightly awesomer). And the most recent post is about a field school in the Pyrenees, a place I love, and contains some awesome annotated field photos from an iPhone app called Theodolite.

Regular readers will already know about the geophysics hackathon we're organizing in Houston in September, timed perfectly as a pre-SEG brain workout. You don't need to be a coder to get involved — if you're excited by the idea of creating new apps for nerds like you, then you're in! Sign up at hackathon.io.

If you crave freshness, then check my Twitter feed or my pinboard. And if you have stuff to share, use the comments or get in touch — or jump on Twitter yourself!

Invitation to a geophysics hackathon

Do you like to build things? Join us for two days of scientific software creation. We'll be in Houston on 21 & 22 September, right before the SEG Annual Meeting, building web and mobile apps to attack one of the unsolved problem themes we exposed in Calgary in May — error and uncertainty

Let's build something together

What displays, or calculators, or simulators, could you dream up to help understand, or compute, or visualize, or communicate, or reduce error and uncertainty in your work? How about stochastic synthetics? Well logs with error bars? Fuzzy inversion?

You don't have to be a programmer — teams need ideas, they need science, they need design, and they need presentation skills. Please bring your creativity and your courage. Bring whatever you have, but mainly your brain

I'm in, what now? 

If want to take part, sign up at hackathon.io. If you have an idea already, start a project there. We are still filling in some blanks but can say that the event will be in downtown Houston, starting at 9 am on Saturday 21 Sept and running till 6 pm on Sunday 22 Sept. It will be free for students; there will probably be a small fee for professionals. We can only take 8 teams, so get in early and be sure not to miss out! 

If you'd like to help make this event happen, we'd love to have you as a sponsor for the event. The two main opportunities for sponsorship are the catering, and the prizes, but we're open to ideasDrop us a line.

Last thing: Please share this post with someone you know who loves to make things. Or help spread us on social media with the hashtag #geophysicshack. Cheers!

10 days on the Mid-Atlantic Ridge

I have just returned from a 10-day holiday in Iceland, an anomalous above-sea-level bump in the North Atlantic's mid-ocean ridge. It sits over a mantle hotspot at the junction of the ridge and the WNW–ESE volcanic province stretching from the Greenland to the Faroes.

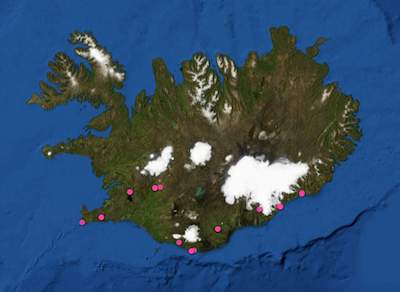
Meteorologically, culinarily, fincancially, Iceland does not score especially highly. But geologically—the only way that really matters—it's the most amazing place I've ever been. And we only visited a few spots (right). Here are some highlights...

Reykjanes. My favourite geological locality was the first place we went, and the most desolate. Barely half-an-hour's drive from the airport, you can go and see the Mid-Atlantic Ridge rise out of the North Atlantic, and start its romp across the country. Reykjanes looks much like you'd expect newborn crust to look: a brutal but pristine landscape of lava, interrupted by clusters of small volcanic cones, elongate fissures, and small grabens. 

Þingvellir. The archetypal rift valley is Þingvellir (Thingvellir), which almost defies description. On top of the textbook geology is a layer of almost magical history — mythical in character, but completely real. For example, you can stand next to the drekkingarhylur (drowning pool), where deviants were executed by drowning, and diligently documented, from about 930 CE onwards. Explorationists know that early rifting is often associated with lacustrine deposits, rapid subsidence, and source rocks. And Iceland's largest lake sits happily in a new (relatively) rift valley, subsiding dutifully since records began. 

Helluhraun (pahoehoe lava) and one of the bounding faults at Þingvellir

Ice. The other thing Iceland has plenty of, apart from lava, is ice. I've seen plenty of glaciers before, and climbed around on a few, but I've never seen them calving icebergs. And I've never seen the products of subglacial eruptions: massive plains of sand dumped by jökulhlaups, and distinctively elongate or flat-topped volcanos.

Icebergs in front of Breiðamerkurjökull

We vowed to return when our youngest, who is only 3 now, is old enough to remember some of it. We mostly stayed in guesthouses, but we decided a camper van is the way to go — there's so much to see. I also realized I need a lot more photographic equipment! And skill.

May linkfest

The monthly News post wasn't one of our most popular features, so it's on the shelf. Instead, I thought I'd share all the most interesting, quirky, mind-blowing, or just plain cool things I've spotted on the web over the last month.

– Do not miss this. One of them stands out above all the others. If you like modern analogs and satellite imagery, you're going to love Google Earth Engine. I've started a list of geologically interesting places to visit — please add to it!

– More amazing images. I'll never get bored of looking at gigapans, and Callan Bentley's are among the best geological ones. I especially like his annotated ones.

– Classic blog. Greg Gbur writes one of the best physics blogs, and his focus is on optics, so there's often good stuff there for geophysicists. This post on Chladni patterns is pure acoustic goodness and well worth a slow read. 

– New geoscience blog. Darren Wilkinson is a young geoscientist in the UK, and writes a nice geeky blog about his research. 

– Brilliant and simple. Rowan Cockett is a student at UBC, but builds brilliant geological web apps on the side. He has a knack for simplicity and his latest creation makes stereonets seem, well, simple. Impressive. 

– New magazine. Kind of. There's not enough satire or ragging in the petroleum press, so it's refreshing to hear of Proved Plus Probable, a fairly wacky weekly online rag emanating from Calgary [thanks to Dan for the tip!]. Top headline: Legendary geologist invents new crayons

– Counter-factual geology. I love these pictures of an imagined ring around earth.

– Never buy graph paper again. Make some just how you like it!

– Bacon. It was a revelation to find that some rocks look just like bacon.

That's it! I share most of this sort of thing on Twitter. Really useful stuff I tend to stick on my pinboard — you're welcome to browse. If you have a geological or geeky bookmark collection, feel free to share it in the comments!

The plainest English

If you're not already reading xkcd — the must-read sciencey thrice-weekly comic strip — then please give it a try. It's good for you. Check out this wonderful description of the Saturn V rocket, aka Up Goer Five, using only the 1000 most common words in English →

This particular comic took on a life of its own last week, when Theo Sanderson built a clever online text editor that parses your words and highlights the verboten ones. Then, following the lead of @highlyanne, a hydrologist, scientists all over Twitter quickly started describing and sharing parsimonious descriptions of what they do. Anne and her partner in crime, @Allochthonous, then compiled a log of every description they could find. It's worth looking at, though it would take a while to read them all. 

What's it like using only the simplest words? I tried to define a well...

A deep, round, empty space in the ground that is only about as wide as your hand. The empty space is very deep: up to about seven tens of hundreds of times as deep as a man is tall. It is full of water. After making the empty space, we can lower small computers into it. As we pull them out, the computers tell us things about the rocks they can 'see' — like how fast waves move through them, or how much water the rocks have in them.

It's quite hard. But refreshingly so. Here's reflection seismic...

We make a very loud, short sound on the land or in the water — like a cracking sound. The sound waves go down through the rocks under the ground. As they do so, some of them come back — just as waves come back from the side of a body of water when you throw in a small rock. We can listen to the sound waves that come back, and use a computer to help make a picture of what it looks like under the ground.

Is a world without jargon dumbed down, or opened up? What is it we do again?...

It is very hard to do this work. It takes a lot of money and a long time. The people that do it have to think hard about how to do it without hurting other people or the world we live in. We don't always manage to do it well, but we try to learn from the past so we can do better next time. Most people think we should stop, but if we did, the world would go dark, our homes would be cold (or hot), and people would not be able to go very far.

Check out Up Goer Six — Theo's new editor that colour codes each word according to just how common it is. Try it — what do you do for a living? 

The image is licensed CC-BY-NC-2.5 by Randall Munroe at xkcd.com.

2012 retrospective

The end of the year is nigh — time for our self-indulgent look-back at 2012. The most popular posts, not counting appearances on the main page. Remarkably, Shale vs tight has about twice the number of hits of the second place post. 

  1. Shale vs tight, 1984 visits

  2. G is for Gather, 1090 visits (to permalink)

  3. What do you mean by average?, 1008 visits (to permalink)

The most commented-on posts are not necessarily the most-read. This is partly because posts get read for months after they're written, but comments tend to come right away. 

  1. Are conferences failing you too? (16 comments)

  2. Your best work(space) (13 comments)

  3. The Agile toolbox (13 comments)

Personal favourites

Evan

Matt

Where our readers come from

The distribution of readers is global, but has a power law distribution. About 75% of our readers this year were from one of nine countries: USA, Canada, UK, Australia, Norway, India, Germany, Indonesia, and Russia. Some of those are big countries, so we should correct for population—let's look at the number of Agile blog readers per million citizens:

2012_blog_readers_logscale.png
  1. Norway — 292

  2. Canada — 283

  3. Australia — 108

  4. UK — 78

  5. Qatar — 72

  6. Brunei — 67

  7. Ireland — 57

  8. Iceland — 56

  9. Denmark — 46

  10. Netherlands — 46

So we're kind of a big deal in Norway. Hei hei Norge! Kansje vi skulle skrive på norsk herifra.

Google Analytics tells us when people visit too. The busiest days are Tuesday, Wednesday, and Thursday, then Monday and Friday. Weekends are just crickets. Not surprisingly, the average reading time rises monotonically from Monday to Friday — reaching a massive 2:48 on Fridays. (Don't worry, dear manager, those are minutes!)

What we actually do

We don't write much about our work on this blog. In brief, here's what we've been up to:

  • Volume interpretation and rock physics for a geothermal field in southern California

  • Helping the Government of Canada get some of its subsurface data together

  • Curating subsurface content in a global oil & gas company's corporate wiki

  • Getting knowledge sharing off the ground at a Canadian oil & gas company

Oh yeah, we did launch this awesome little book too. That was a proud moment. 

We're looking forward to a fun-filled, idea-jammed, bee-busy 2013 — and wish the same for you. Thank you for your support and encouragement this year. Have a fantastic Yuletide.

How to make a geologist happy

It's that time of year! Students are sitting exams, the northern oil patch is mobilizing, my boatshed office gets a bit chilly, and everyone is talking about AGU. And friends of geologists start wondering what the heck to get for them this Yuletide.

For the diehard field geologist

Maps are the field geoscientist's most basic tool. I have a soft spot for beautiful old maps. And beautiful maps are beautiful. Also expensive. But also beautiful.

A balloon flight over somewhere as geologically remarkable as Cappadocia (right), the Grand CanyonMalham Cove, or the Bay of Fundy would give anyone, geologist or not, something to remember forever. Especially if they are terrified of heights. 

I can't even tell you how much I want a portable Geiger–Müller counter. Almost as much as I want one of Little River's stream tables in my garage. (You could always start off with a budget version). Those Little River guys caused quite a stir with their scale bar pencils last year — you'll have to call them for one, but in the meantime, the forensic photography world has lots of nice scales for the field and lab.

Gifts in spaaaace

Small things are awesome. (Did you see our post last week about Robert Hooke? He liked small things.) You can look at small things all day with this nifty digital microscope. Need something cool to look at? Get some little pieces of scrap metal. From space. Especially this beauty from Manitoba. (How good did you say you've been?)

Geologists aren't exactly sartorially renowned — unless there's GoreTex to be had, obviously — and T-shirts are de rigueur in all conceivable social situations. Avoid that tempting Schist Happens slogan and go for awesome design instead. Like these nice cross-sections (below), only slightly spoiled by the lettering and those dodgy sleeves. I think the peace sign is my favourite. The mineral samples are pretty great though.

If you like textiles, but not tees, try some geological embroidery.

Wrap up and read

T-shirts, while practical and (sometimes) cool, aren't seasonal apparel in every part of the world. We Canadian geologists mostly don chunky jumpers and stay indoors in the winter. So what we need is books. Here's a book about geology and whisky — an ethereal combination. (Read it with a glass of this lovely stuff). And here's a beautiful book of Postcards From Mars. Want something more arty? Andy Goldsworthy is your man (left). And finally, in a shameless plug, who doesn't want to know more about geophysics?

Still stuck? Check our reading list. Not good enough? There are lots more ideas in our 2011 giftology and 2010 giftophysics posts. And you'll find even more geeky awesomeness over at Georneys. If, after all that, you spot something even more giftological, please tell us about it in the comments!

The photo of balloons over Cappadocia is licensed CC-BY-NC by Flickr user Stephen Oung. The T-shirt images are copyright of their respective owners and assumed to be fair use. The Goldsworthy image is licensed CC-BY-SA by Wikipedia user mikeanegus

Cross plots: a non-answer

On Monday I asked whether we should make crossplots according to statistical rules or natural rules. There was some fun discussion, and some awesome computation from Henry Herrera, and a couple of gems:

Physics likes math, but math doesn't care about physics — @jeffersonite

But... when I consider the intercept point I cannot possibly imagine a rock that has high porosity and zero impedance — Matteo Niccoli, aka @My_Carta

I tried asking on Stack Overflow once, but didn’t really get to the bottom of it, or perhaps I just wasn't convinced. The consensus seems to be that the statistical answer is to put porosity on y-axis, because that way you minimize the prediction error on porosity. But I feel—and this is just my flaky intuition talking—like this fails to represent nature (whatever that means) and so maybe that error reduction is spurious somehow.

Reversing the plot to what I think of as the natural, causation-respecting plot may not be that unreasonable. It's effectively the same as reducing the error on what was x (that is, impedance), instead of y. Since impedance is our measured data, we could say this regression respects the measured data more than the statistical, non-causation-respecting plot.

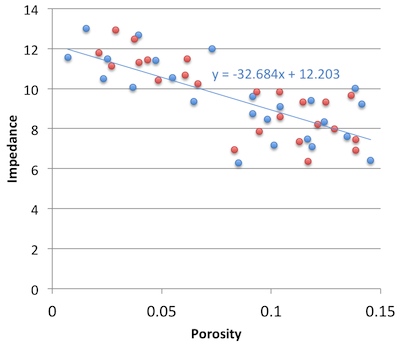
So must we choose? Minimize the error on the prediction, or minimize the error on the predictor. Let's see. In the plot on the right, I used the two methods to predict porosity at the red points from the blue. That is, I did the regression on the blue points; the red points are my blind data (new wells, perhaps). Surprisingly, the statistical method gives an RMS error of 0.034, the natural method 0.023. So my intuition is vindicated! 

Unfortunately if I reverse the datasets and instead model the red points, then predict the blue, the effect is also reversed: the statistical method does better with 0.029 instead of 0.034. So my intuition is wounded once more, and limps off for an early bath.

Irreducible error?

Here's what I think: there's an irreducible error of prediction. We can beg, borrow or steal error from one variable, but then it goes on the other. It's reminiscent of Heisenberg's uncertainty principle, but in this case, we can't have arbitrarily precise forecasts from imperfectly correlated data. So what can we do? Pick a method, justify it to yourself, test your assumptions, and then be consistent. And report your errors at every step. 

I'm reminded of the adage 'Correlation does not equal causation.' Indeed. And, to borrow @jeffersonite's phrase, it seems correlation also does not care about causation.