Getting started with Modelr

Let's take a closer look at modelr.io, our new modeling tool. Just like real seismic experiments, there are four components:

  • Make a framework. Define the geometries of rock layers.
  • Make an earth. Assign a set of rock properties to each layer.
  • Make a kernel. Define the seismic survey.
  • Make a plot. Set the output parameters.

Modelr takes care of the physics of wave propagation and reflection, so you don't have to stick with normal incidence acoustic impedance models if you don't want to. You can explore the full range of possibilities.

3 ways to slice a wedge

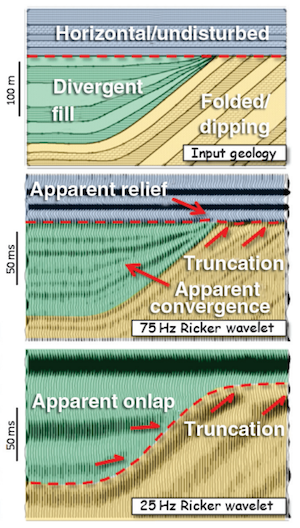
To the uninitiated, the classic 3-layer wedge model may seem ridiculously trivial. Surely the earth looks more complicated than that! But we can leverage such geometric simplicity to systematically study how seismic waveforms change across spatial and non-spatial dimensions. 

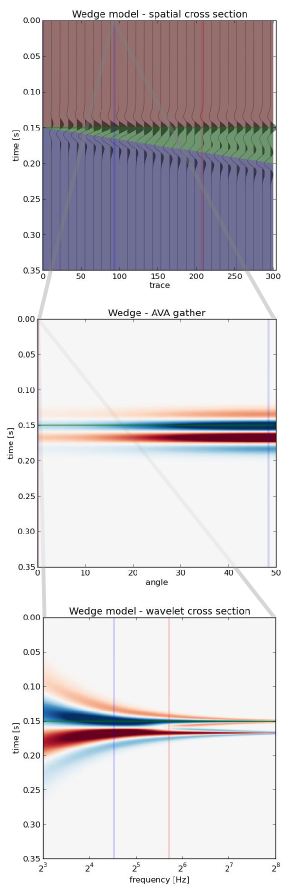
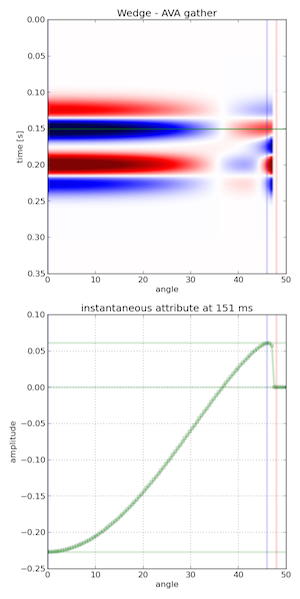
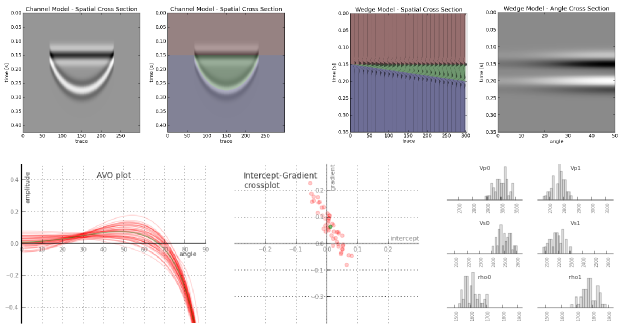
Spatial domain. In cross-section (right), a seismic wedge model lets you analyse the resolving power of a given wavelet. In this display the onset of tuning is marked by the vertical red line, and the thickness at which maximum tuning occurs is shown in blue. Reflection profiles can be shown for any incidence angle, or range of incidence angles (offset stack).

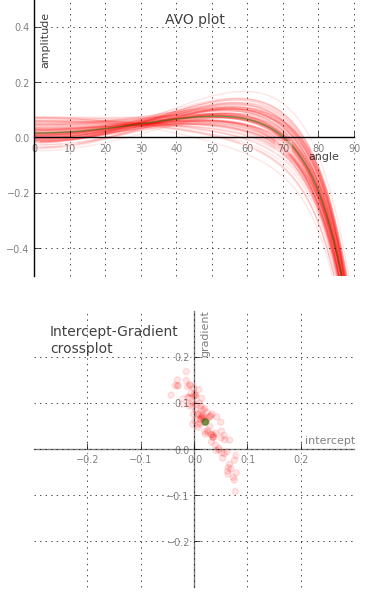
Amplitude versus angle (AVA) domain. Maybe you are working on a seismic inversion problem so you might want to see what a CDP angle gather looks like above and below tuning thickness. Will a tuned AVA response change your quantitative analysis? This 3-layer model looks like a two-layer AVA gather except our original wavelet looks like it has undergone a 90 degree phase rotation. Looks can be deceiving. 

Amplitude versus frequency domain. If you are trying to design a seismic source for your next survey, and you want to ensure you've got sufficient bandwidth to resolve a thin bed, you can compute a frequency gather — right, bottom — and explore a swath of wavelets with regard to critical thickness in your prospect. The tuning frequency (blue) and resolving frequency (red) are revealed in this domain as well. 

Wedges are tools for seismic waveform classification. We aren't just interested in digitizing peaks and troughs, but the subtle interplay of amplitude tuning, and apparent phase rotation variations across the range of angles and bandwidths in the seismic experiment. We need to know what we can expect from the data, from our supposed geology. 

In a nutshell, all seismic models are about illustrating the band-limited nature of seismic data on specific geologic scenarios. They help us calibrate our intuition when bandwidth causes ambiguity in interpretation. Which is nearly all of the time.

How to load SEG-Y data

Yesterday I looked at the anatomy of SEG-Y files. But it's pathology we're really interested in. Three times in the last year, I've heard from frustrated people. In each case, the frustration stemmed from the same problem. The epic email trails led directly to these posts. Next time I can just send a URL!

In a nutshell, the specific problem these people experienced was missing or bad trace location data. Because I've run into this so many times before, I never trust location data in a SEG-Y file. You just don't know where it's been, or what has happened to it along the way — what's the datum? What are the units? And so on. So all you really want to get from the SEG-Y are the trace numbers, which you can then match to a trustworthy source for the geometry.

Easy as 1-2-3, er, 4

This is my standard approach to loading data. Your mileage will vary, depending on your software and your data. 

  1. Find the survey geometry information. For 2D data the geometry is usually in a separate navigation ('nav') file. For 3D you are just looking for cornerpoints, and something indicating how the lines and crosslines are numbered (they might not start at 1, and might not be oriented how you expect). This information may be in the processing report or, less reliably, in the EBCDIC text header of the SEG-Y file.
  2. Now define the survey geometry. You need a location for every trace for a 2D, and the survey's cornerpoints for a 3D. The geometry is a description of where the line goes on the earth, in surface coordinates, and where the starting trace is, how many traces there are, and what the trace spacing is. In other words, the geometry tells you where the traces go. It's variously called 'navigation', 'survey', or some other synonym.
  3. Finally, load the traces into their homes, one vintage (survey and processing cohort) at a time for 2D. The cross-reference between the geometry and the SEG-Y file is the trace or CDP number for a 2D, and the line and crossline numbers for a 3D.
  4. Check everything twice. Does the map look right? Is the survey the right shape and size? Is the line spacing right? Do timeslices look OK?

Where to get the geometry data?

So, where to find cornerpoints, line spacings, and so on? Sadly, the header cannot be trusted, even in newly-processed data. If you have it, the processing report is a better bet. It often helps to talk to someone involved in the acquisition and processing too. If you can corroborate with data from the acqusition planning (line spacings, station intervals, and so on), so much the better — but remember that some acquisition parameters may have changed during the job.

Of vital importance is some independent corroboration— a map, ideally —of the geometry and the shape and orientation of the survey. I can't count the number of back-to-front surveys I've seen. I even saw one upside-down (in the z dimension) once, but that's another story.

Next time, I'll break down the loading process a bit more, with some step-by-step for loading the data somewhere you can see it.

What is SEG-Y?

The confusion starts with the name, but whether you write SEGY, SEG Y, or SEG-Y, it's probably definitely pronounced 'segg why'. So what is this strange substance?

SEG-Y means seismic data. For many of us, it's the only type of seismic file we have much to do with — we might handle others, but for the most part they are closed, proprietary formats that 'just work' in the application they belong to (Landmark's brick files, say, or OpendTect's CBVS files). Processors care about other kinds of data — the SEG has defined formats for field data (SEG-D) and positional data (SEG-P), for example. But SEG-Y is the seismic file for everyone. Kind of.

The open SEG-Y "standard" (those air quotes are an important feature of the standard) was defined by SEG in 1975. The first revision, Rev 1, was published in 2002. The second revision, Rev 2, was announced by the SEG Technical Standards Committee at the SEG Annual Meeting in 2013 and I imagine we'll start to see people using it in 2014. 

What's in a SEG-Y file?

SEG-Y files have lots of parts:

The important bits are the EBCDIC header (green) and the traces (light and dark blue).

The EBCDIC text header is a rich source of accurate information that provides everything you need to load your data without problems. Yay standards!

Oh, wait. The EBCDIC header doesn't say what the coordinate system is. Oh, and the datum is different from the processing report. And the dates look wrong, and the trace length is definitely wrong, and... aargh, standards!

The other important bit — the point of the whole file really — is the traces themselves. They also have two parts: a header (light blue, above) and the actual data (darker blue). The data are stored on the file in (usually) 4-byte 'words'. Each word has its own address, or 'byte location' (a number), and a meaning. The headers map the meaning to the location, e.g. the crossline number is stored in byte 21. Usually. Well, sometimes. OK, it was one time.

According to the standard, here's where the important stuff is supposed to be:

I won't go into the unpleasantness of poking around in SEG-Y files right now — I'll save that for next time. Suffice to say that it's often messy, and if you have access to a data-loading guru, treat them exceptionally well. When they look sad — and they will look sad — give them hugs and hot tea. 

What's so great about Rev 2?

The big news in the seismic standards world is Revision 2. According to this useful presentation by Jill Lewis (Troika International) at the Standards Leadership Council last month, here are the main features:

  • Allow 240 byte trace header extensions.
  • Support up to 231 (that's 2.1 billion!) samples per trace and traces per ensemble.
  • Permit arbitrarily large and small sample intervals.
  • Support 3-byte and 8-byte sample formats.
  • Support microsecond date and time stamps.
  • Provide for additional precision in coordinates, depths, elevations.
  • Synchronize coordinate reference system specification with SEG-D Rev 3.
  • Backward compatible with Rev 1, as long as undefined fields were filled with binary zeros.

Two billion samples at µs intervals is over 30 minutes Clearly, the standard is aimed at <ahem> Big Data, and accommodating the massive amounts of data coming from techniques like variable timing acquisition, permanent 4D monitoring arrays, and microseismic. 

Next time, we'll look at loading one of these things. Not for the squeamish.

Calibrate your seismic intuition

On Tuesday we announced our new web app, modelr.io. Why are we so excited about it? 

  • We love the idea that subsurface software can cost dollars, not 1000's of dollars. 
  • We love the idea of subsurface software being online, not on the desktop.
  • We love the idea that subsurface software can be open source. Here's our code!
  • We love the idea of subsurface software that doesn't need a manual to master.
  • We love the idea of subsurface software that runs on a tablet or a phone.
  • We see software as an important way to share knowledge and connect people.

OK, that's enough reasons. There are more. Those are the main ones.

The point is: we love these ideas. And we hope that you, dear reader, at least like some of them a bit. Because we really want to keep developing modelr. We think it can be awesome. Imagine 3D earth models, imagine full waveform modeling, imagine gravity and magnetic models. We get very excited when we think about all the possiblities. There's no better way to calibrate your seismic intuition than modeling, and modelr is a great place to start modeling. 

Here's a challenge: take 3 minutes and see if you can generate...

 A wedge model & tuning curve An AVA gather for a Class 4 sand    A stochastic AVA crossplot          

 modelr seismic wedge modelmodelr seismic avo modelmodelr stochastic avo  model

The most important thing nobody does

A couple of weeks ago, we told you we were up to something. Today, we're excited to announce modelr.io — a new seismic forward modeling tool for interpreters and the seismically inclined.

Modelr is a web app, so it runs in the browser, on any device. You don't need permission to try it, and there's never anything to install. No licenses, no dongles, no not being able to run it at home, or on the train.

Later this week, we'll look at some of the things Modelr can do. In the meantime, please have a play with it.
Just go to modelr.io and hit Demo, or click on the screenshot below. If you like what you see, then think about signing up — the more support we get, the faster we can make it into the awesome tool we believe it can be. And tell your friends!

If you're intrigued but unconvinced, sign up for occasional news about Modelr:

This will add you to the email list for the modeling tool. We never share user details with anyone. You can unsubscribe any time.

A long weekend of creative geoscience computing

The Rock Hack is in three weeks. If you're in Houston, for AAPG or otherwise, this is going to be a great opportunity to learn some new computer skills, build some tools, or just get some serious coding done. The Agile guys — me, Evan, and Ben — will be hanging out at START Houston, laptops open, all say 5 and 6 April, about 8:30 till 5. The breakfast burritos and beers are on us.

Unlike the geophysics hackathon last September, this won't be a contest. We're going to try a more relaxed, unstructured event. So don't be shy! If you've always wanted to try building something but don't know where to start, or just want to chat about The Next Big Thing in geoscience or technology — please drop in for an hour, or a day.

Here are some ideas we're kicking around for projects to work on:

  • Sequence stratigraphy calibration app to tie events to absolute geologic time and to help interpret systems tracts.
  • Wireline log 'attributes'.
  • Automatic well-to-well correlation.
  • Facies recognition from core.
  • Automatic photomicrograph interpretation: grain size, porosity, sorting, and so on.
  • A mobile app for finding and capturing data about outcrops.
  • An open source basin modeling tool.

Short course

If you feel like a short course would get you started faster, then come along on Friday 4 April. Evan will be hosting a 1-day course, leading you through getting set up for learning Python, learning some syntax, and getting started on the path to scientific computing. You won't have super-powers by the end of the day, but you'll know how to get them.

Eventbrite - Agile Geocomputing

The course includes food and drink, and lots of code to go off and play with. If you've always wanted to get started programming, this is your chance!

Purposeful discussion in geoscience

Regular readers will remember the Unsolved Problems Unsession at the GeoConvention in Calgary last May. We think these experiments in collaboration are one possible way to get people more involved in progressing geoscience at conferences, and having something to show for it. We plan to do more — and are here to support you if you'd like to try one in your community.

Last Thursday was the 2014 CSEG Symposium. The organizers asked me for a short video to sum up what happened at the unsession for the crowd, and to help get them in the mood for some discussion. I hope it helped...

Getting better

Conferences seem so crammed with talks these days. No time for good conversation, in or out of the sessions. The only decent discussion I remember recently (apart from the unsession, obvsly) was at EAGE in 2012, when a talk finished early and the space filled with a fascinating discussion between two compressed sensing clever-clogs.

I think there are a few ways to get better at it:

  • Make more time for it, preferably at least 40 minutes.
  • Get people into smaller groups, about 4–12 people is good.
  • Facilitate with some ground rules, provocative questions, and conversation management.
  • Capture what was said, preferably in real time and using the participants' own words.
  • Use lots of methods: drawing, sticky notes, tweets, video, and so on.
  • Reflect the conversation back at the participants, and let them respond.
  • Read up on open space, knowledge café, charrettes, and other methods.
  • Don't shut it down with "I guess we're out of time..." — review or sum up first.

Think about when you have been part of a really good conversation. How it feels, how it flows, and how you remember it for days afterwards, and mention it to others later. I think we can have more of those about our work, and conferences are a great place to help them happen.

Stay tuned for details of the next unsession — again, at the Calgary GeoConvention.

Relentlessly practical

This is one of my favourite knowledge sharing stories.

A farmer in my community had a problem with one of his cows — it was seriously unwell. He asked one of the old local farmers about the symptoms, and was told, “Oh yes, one of my herd had the same thing last summer. I gave her a cup of brandy and four aspirins every night for a week.” The young farmer went off and did this, but the poor cow got steadily worse and died. When he saw the old farmer next he told him, more than a little accusingly, “I did what you said, and the cow died anyway.” The old geezer looked into the distance and just said, “Yep, so did mine.”

Incomplete information can be less useful than no information. Yet incomplete information has somehow become our specialty in applied geoscience. How often do we share methods, results, or case studies without the critical details that would make it useful information? That is, not just marketing, or resumé padding. Inded, I heard this week that one large US operator will not approve a publication that does include these critical details! And we call ourselves scientists...

Completeness mandatory

Thankfully, Last month The Leading Edge — the magazine of the SEG — started a new tutorial column, edited by me. Well, I say 'edited', I'm just the person that pesters prospective authors until they give in and send me a manuscript. Tad Smith, Don Herron, and Jenny Kucera are the people that make it actually happen. But I get to take all the credit.

When I was asked about it, I suggested two things:

  1. Make each tutorial reproducible by publishing the code that makes the figures.
  2. Make the words, the data, and the code completely open and shareable. 

To my delight and, I admit, slight surprise, they said 'Sure!'. So the words are published under an open license (Creative Commons Attribution-ShareAlike, the same license for re-use that most of Wikipedia has), the tutorials use open data for everything, and the code is openly available and free to re-use. Complete transparency.

There's another interesting aspect to how the column is turning out. The first two episodes tell part of the story in IPython Notebook, a truly amazing executable writing environment that we've written about before. This enables you to seamlessly stich together text, code, and plots (left). If you know a bit of Python, or want to start learning it right now this second, go give wakari.io a try. It's pretty great. (If you really like it, come and learn more with us!).

Read the first tutorial: Hall, M. (2014). Smoothing surfaces and attributes. The Leading Edge, 33(2), 128–129. doi: 10.1190/tle33020128.1. A version of it is also on SEG Wiki, and you can read the IPython Notebook at nbviewer.org.

Do you fancy authoring something for this column? Wonderful — please do! Here are the author instructions. If you have an idea for something, please drop me a line, let's talk about how to make it relentlessly practical.

Transforming geology into seismic

Hart (2013). ©SEG/AAPGForward modeling of seismic data is the most important workflow that nobody does.

Why is it important?

  • Communicate with your team. You know your seismic has a peak frequency of 22 Hz and your target is 15–50 m thick. Modeling can help illustrate the likely resolution limits of your data, and how much better it would be with twice the bandwidth, or half the noise.
  • Calibrate your attributes. Sure, the wells are wet, but what if they had gas in that thick sand? You can predict the effects of changing the lithology, or thickness, or porosity, or anything else, on your seismic data.
  • Calibrate your intuition. Only by predicting the seismic reponse of the geology you think you're dealing with, and comparing this with the response you actually get, can you start to get a feel for what you're really interpreting. Viz Bruce Hart's great review paper we mentioned last year (right).

Why does nobody do it?

Well, not 'nobody'. Most interpreters make 1D forward models — synthetic seismograms — as part of the well tie workflow. Model gathers are common in AVO analysis. But it's very unusual to see other 2D models, and I'm not sure I've ever seen a 3D model outside of an academic environment. Why is this, when there's so much to be gained? I don't know, but I think it has something to do with software.

  • Subsurface software is niche. So vendors are looking at a small group of users for almost any workflow, let alone one that nobody does. So the market isn't very competitive.
  • Modeling workflows aren't rocket surgery, but they are a bit tricky. There's geology, there's signal processing, there's big equations, there's rock physics. Not to mention data wrangling. Who's up for that?
  • Big companies tend to buy one or two licenses of niche software, because it tends to be expensive and there are software committees and gatekeepers to negotiate with. So no-one who needs it has access to it. So you give up and go back to drawing wedges and wavelets in PowerPoint.

Okay, I get it, how is this helping?

We've been busy lately building something we hope will help. We're really, really excited about it. It's on the web, so it runs on any device. It doesn't cost thousands of dollars. And it makes forward models...

That's all I'm saying for now. To be the first to hear when it's out, sign up for news here:

This will add you to the email list for the modeling tool. We never share user details with anyone. You can unsubscribe any time.

Seismic models: Hart, BS (2013). Whither seismic stratigraphy? Interpretation, volume 1 (1). The image is copyright of SEG and AAPG.

Creating in the classroom

The day before the Atlantic Geoscience Colloquium, I hosted a one-day workshop on geoscience computing to 26 maritime geoscientists. This was my third time running this course. Each time it has needed tailoring and new exercises to suit the crowd; a room full of signal-processing seismologists has a different set of familiarities than one packed with hydrologists, petrologists, and cartographers. 

Easier to consume than create

At the start of the day, I asked people to write down the top five things they spend time doing with computers. I wanted a record of the tools people use, but also to take collective stock of our creative, as opposed to consumptive, work patterns. Here's the result (right).

My assertion was that even technical people spend most of their time in relatively passive acts of consumption — browsing, emailing, and so on. Creative acts like writing, drawing, or using software were in the minority, and only a small sliver of time is spent programming. Instead of filing into a darkened room and listening to PowerPoint slides, or copying lectures notes from a chalkboard, this course was going to be different. Participation mandatory.

My goal is not to turn every geoscientist into a software developer, but to better our capacity to communicate with computers. Giving people resources and training to master this medium that warrants a new kind of creative expression. Through coaching, tutorials, and exercises, we can support and encourage each other in more powerful ways of thinking. Moreover, we can accelerate learning, and demystify computer programming by deliberately designing exercises that are familiar and relevant to geoscientists. 

Scientific computing

In the first few hours students learned about syntax, built-in functions, how and why to define and call functions, as well as how to tap into external code libraries and documentation. Scientific computing is not necessarily about algorithm theory, passing unit tests, or designing better user experiences. Scientists are above all interested in data, and data processes, helped along by rich graphical displays for story telling.

Elevation model (left), and slope magnitude (right), Cape Breton, Nova Scotia. Click to enlarge.

In the final exercise of the afternoon, students produced a topography map of Nova Scotia (above left) from a georeferenced tiff. Sure, it's the kind of thing that can be done with a GIS, and that is precisely the point. We also computed some statistical properties to answer questions like, "what is the average elevation of the province?", or "what is the steepest part of the province?". Students learned about doing calculus on surfaces as well as plotting their results. 

Programming is a learnable skill through deliberate practice. What's more, if there is one thing you can teach yourself on the internet, it is computer programming. Perhaps what is scarce though, is finding the time to commit to a training regimen. It's rare that any busy student or working professional can set aside a chunk of 8 hours to engage in some deliberate coaching and practice. A huge bonus is to do it alongside a cohort of like-minded individuals willing and motivated to endure the same graft. This is why we're so excited to offer this experience — the time, help, and support to get on with it.

How can I take the course?

We've scheduled two more episodes for the spring, conveniently aligned with the 2014 AAPG convention in Houston, and the 2014 CSPG / CSEG convention in Calgary. It would be great to see you there!

Eventbrite - Agile Geocomputing  Eventbrite - Agile Geocomputing

Or maybe a customized in-house course would suit your needs better? We'd love to help. Get in touch.