News headlines

Our old friend the News post... We fell off the wagon there for a bit. From now on we'll just post news when we collect a few stories, or as it happens. If you miss the old last-Friday-of-the-month missive, we are open to being convinced!

First release of Canopy

Back in November we mentioned Canopy, Austin-based Enthought's new Python programming environment, especially aimed at scientists. Think of it as Python (an easy-to-use language) in MATLAB form (with file management, plotting, etc.). Soon, Enthought plan to add a geophysical toolbox — SEGY read/write, trace display, and so on. We're very, very excited for the future of rapid geophysical problem-solving! More on the Enthought blog.

The $99 supercomputer

I recently got a Raspberry Pi — a $35 Linux machine a shade larger than a credit card. We're planning to use it at The HUB South Shore to help kids learn to code. These little machines are part of what we think could be an R&D revolution, as it gets cheaper and cheaper to experiment. Check out the University of Southampton's Raspberry Pi cluster!

If that's not awesome enough for you, how about Parallella, which ships this summer and packs 64 cores for under $100! If you're a software developer, you need to think about whether your tools are ready for parallel processing — not just on the desktop, but everywhere. What becomes possible?

Geophysics + 3D printing = awesome

Unless you have been living on a seismic boat for the last 3 years, you can't have failed to notice 3D printing. I get very excited when I think about the possibilities — making real 3D geomodels, printing replacement parts in the field, manifesting wavefields, geobodies, and so on. The best actual application we've heard of so far — these awesome little physical models in the Allied Geophysical Laboratories at the University of Houston (scroll down a bit).

Sugru

Nothing to do with geophysics, but continuing the hacker tech and maker theme... check out sugru.com — amazing stuff. Simple, cheap, practical. I am envisaging a maker lab for geophysics — who wants in?

Is Oasis the new Ocean?

Advanced Seismic is a Houston-based geophysical software startup that graduated from the Surge incubator in 2012. So far, they have attracted a large amount of venture capital, and I understand they're after tens of millions more. They make exciting noises about Oasis, a new class of web-aware, social-savvy software with freemium pricing. But so far there's not a lot to see — almost everything on their site says 'coming soon' and Evan and I have had no luck running the (Windows-only) demo tool. Watch this space.
Slow pitch

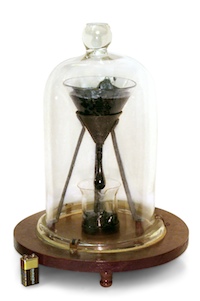
The world's longest-running lab experiment is a dripping flask of pitch, originally set up in 1927. The hydrocarbon has a viscosity of about 8 billion centipoise, which is 1000 times more viscous than Alberta bitumen. So far 8 drops have fallen, the last on 28 November 2000. The next? Looks like any day now! Or next year. 

Image: University of Queensland, licensed CC-BY-SA. 

Machines can read too

The energy industry has a lot of catching up to do. Humanity is faced with difficult, pressing problems in energy production and usage, yet our industry remains as secretive and proprietary as ever. One rich source of innovation we are seriously under-utilizing is the Internet. You have probably heard of it.

Machine experience design

semantic.jpg

Web sites are just the front-end of the web. Humans have particular needs when they read web pages — attractive design, clear navigation, etc. These needs are researched and described by the rapidly growing field of user experience design, often called UX. (Yes, the ways in which your intranet pages need fixing are well understood, just not by your IT department!)

But the web has a back-end too. Rather than being for human readers, the back-end is for machines. Just like human readers, machines—other computers—also have particular needs: structured data, and a way to make queries. Why do machines need to read the web? Because the web is full of data, and data makes the world go round. 

So website administrators need to think about machine experience design too. As well as providing beautiful web pages for humans to read, they should provide widely-accepted machine-readable format such as JSON or XML, and a way to make queries.

What can we do with the machine-readable web?

The beauty of the machine-readable web, sometimes called the semantic web, or Web 3.0, is that developers can build meta-services on it. For example, a website like hipmunk.com that finds the best flights, wherever they are. Or a service that provides charts, given some data or a function. Or a mobile app that knows where to get the oil price. 

In the machine-readable web, you could do things like:

  • Write a program to analyse bibliographic data from SEG, SPE and AAPG.
  • Build a mobile app to grab log mnemonics info from SLB's, HAL's, and BHI's catalogs.
  • Grab course info from AAPG, PetroSkills, and Nautilus to help people find training they need.

Most wikis have a public application programming interface, giving direct, machine-friendly access to the wiki's database. Here are two views of one wiki page — click on the images to see the pages:

At SEG last year, I suggested to a course provider that they might consider offering machine access to their course catalog—so that developers can build services that use their course information and thus send them more students. They said, "Don't worry, we're building better search tools for our users." Sigh.

In this industry, everyone wants to own their own portal, and tends to be selfish about their data and their users. The problem is that you don't know who your users are, or rather who they could be. You don't know what they will want to do with your data. If you let them, they might create unimagined value for you—as hipmunk.com does for airlines with reasonable prices, good schedules, and in-flight Wi-Fi. 

I can't wait for the Internet revolution to hit this industry. I just hope I'm still alive.

Making images or making prospects?

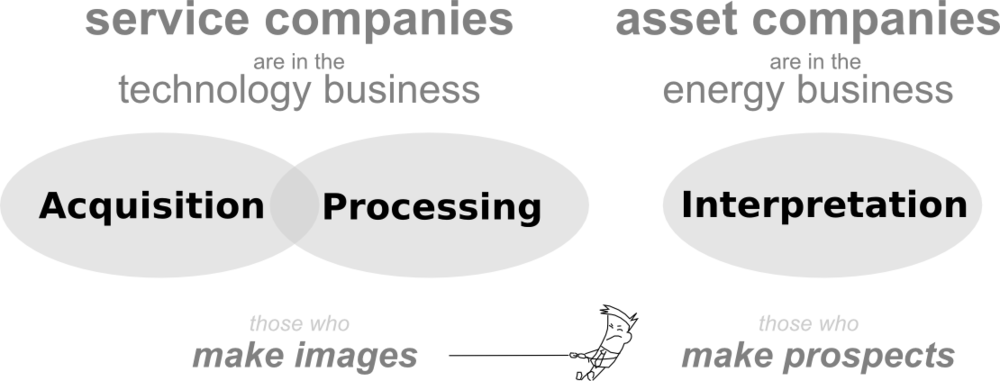
Well-rounded geophysicists will have experience in each of the following three areas: acquisition, processing, and interpretation. Generally speaking, these three areas make up the seismic method, each requiring highly specified knowledge and tools. Historically, energy companies used to control the entire spectrum, owning the technology, the know-how and the risk, but that is no longer the case. Now, service companies do the acquisition and the processing. Interpretation is largely hosted within E & P companies, the ones who buy land and drill wells. Not only has it become unreasonable for a single geophysicist to be proficient across the board, but organizational structures constrain any particular technical viewpoint. 

Aligning with the industry's strategy, if you are a geophysicist, you likely fall into one of two camps: those who make images, or those who make prospects. One set of people to make the data, one set of people to do the interpretation.

This seems very un-scientific to me.

Where does science fit in?

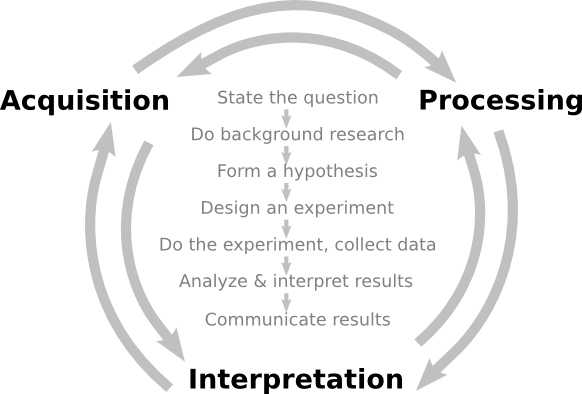
Science, the standard approach of rational inquiry and accruing knowledge, is largely vacant from the applied geophysical business landscape. But, when science is used as a model, making images and making prospects are inseperable.

Can applied geophysics use scientific behaviour as a central anchor across disciplines?

There is a significant amount of science that is needed in the way that we produce observations, in the way that we make images. But the business landscape built on linear procedures leaves no wiggle room for additional testing and refinement. How do processors get better if they don't hear about their results? As a way of compensating, processing has deflected away from being a science of questioning, testing, and analysis, and moved more towards, well,... a process.

The sure-fire way to build knowledge and decrease uncertainty, is through experimentation and testing. In this sense this notion of selling 'solutions', is incompatible with scientific behavior. Science doesn't claim to give solutions, science doesn't claim to give answers, but it does promise to address uncertainty; to tell you what you know.

In studying the earth, we have to accept a lack of clarity in our data, but we must not accept mistakes, errors, or mediocrity due to shortcomings in our shared methodologies.

We need a new balance. We need more connectors across these organizational and disciplinary divides. That's where value will be made as industry encounters increasingly tougher problems. Will you be a connector? Will you be a subscriber to science?

Hall, M (2012). Do you know what you think you know? CSEG Recorder 37 (2), February 2012, p 26–30. Free to download from CSEG. 

Cope don't fix

Some things genuinely are broken. International financial practices. Intellectual property law. Most well tie software. 

But some things are the way they are because that's how people like them. People don't like sharing files, so they stash their own. Result: shared-drive cancer — no, it's not just your shared drive that looks that way. The internet is similarly wild, chaotic, and wonderful — but no-one uses Yahoo! Directory to find stuff. When chaos is inevitable, the only way to cope is fast, effective search

So how shall we deal with the chaos of well log names? There are tens of thousands — someone at Schlumberger told me last week that they alone have over 50,000 curve and tool names. But these names weren't dreamt up to confound the geologist and petrophysicist — they reflect decades of tool development and innovation. There is meaning in the morasse.

Standards are doomed

Twelve years ago POSC had a go at organizing everything. I don't know for sure what became of the effort, but I think it died. Most attempts at standardization are doomed. Standards are awash with compromise, so they aren't perfect for anything. And they can't keep up with changes in technology, because they take years to change. Doomed.

Instead of trying to fix the chaos, cope with it.

A search tool for log names

We need a search tool for log names. Here are some features it should have:

  • It should be free, easy to use, and fast
  • It should contain every log and every tool from every formation evaluation company
  • It should provide human- and machine-readable output to make it more versatile
  • You should get a result for every search, never drawing a blank
  • Results should include lots of information about the curve or tool, and links to more details
  • Users should be able to flag or even fix problems, errors, and missing entries in the database

To my knowledge, there are only two tools a little like this: Schlumberger's Curve Mnemonic Dictionary, and the SPWLA's Mnemonics Data Search. Schlumberger's widget only includes their tools, naturally. The SPWLA database does at least include curves from Baker Hughes and Halliburton, but it's at least 10 years out of date. Both fail if the search term is not found. And they don't provide machine-readable output, only HTML tables, so it's difficult to build a service on them.

Introducing fuzzyLAS

We don't know how to solve this problem, but we're making a start. We have compiled a database containing 31,000 curve names, and a simple interface and web API for fuzzily searching it. Our tool is called fuzzyLAS. If you'd like to try it out, please get in touch. We'd especially like to hear from you if you often struggle with rogue curve mnemonics. Help us build something useful for our community.

Seismic texture attributes — in the open at last

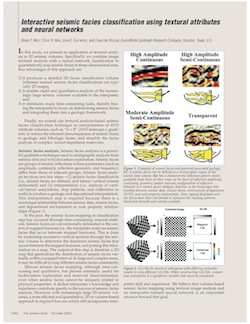
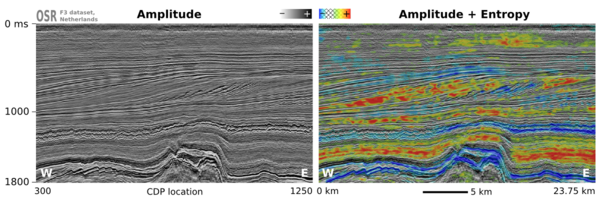
I read Brian West's paper on seismic facies a shade over ten years ago (West et al., 2002, right). It's a very nice story of automatic facies classification in seismic — in a deep-water setting, presumably in the Gulf of Mexico. I have re-read it, and handed it to others, countless times.

Ever since, for over a decade, I've wanted to be able to reproduce this workflow. It's one of the frustrations of the non-programming geophysicist that such reproduction is so hard (or expensive!). So hard that you may never quite manage it. Indeed, it took until this year, when Evan implemented the workflow in MATLAB, for a geothermal project. Phew!

But now we're moving to SciPy for our scientific programming, so Evan was looking at building the workflow again... until Paul de Groot told me he was building texture attributes into OpendTect, dGB's awesome, free, open source seismic interpretation tool. And this morning, the news came: OpendTect 4.4.0e is out, and it has Haralick textures! Happy Christmas, indeed. Thank you, dGB.

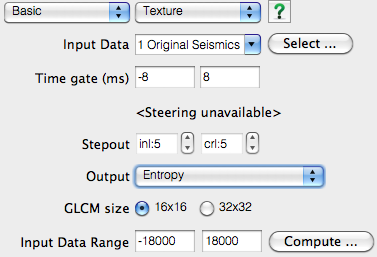
Parameters

There are 4 parameters to set, other than selecting an attribute. Choose a time gate and a kernel size, and the number of grey levels to reduce the image to (either 16 or 32 — more options might be nice here). You also have to choose the dynamic range of the data — don't go too wide with only 16 grey levels, or you'll throw almost all your data into one or two levels. Only the time gate and kernel size affect the run time substantially, and you'll want them to be big enough to capture your textures. 

Reference
West, B, S May, J Eastwood, and C Rossen (2002). Interactive seismic faces classification using textural attributes and neural networks. The Leading Edge, October 2002. DOI: 10.1190/1.1518444

The seismic dataest is the F3 offshore Netherlands volume from the Open Seismic Repository, licensed CC-BY-SA.

The digital well scorecard

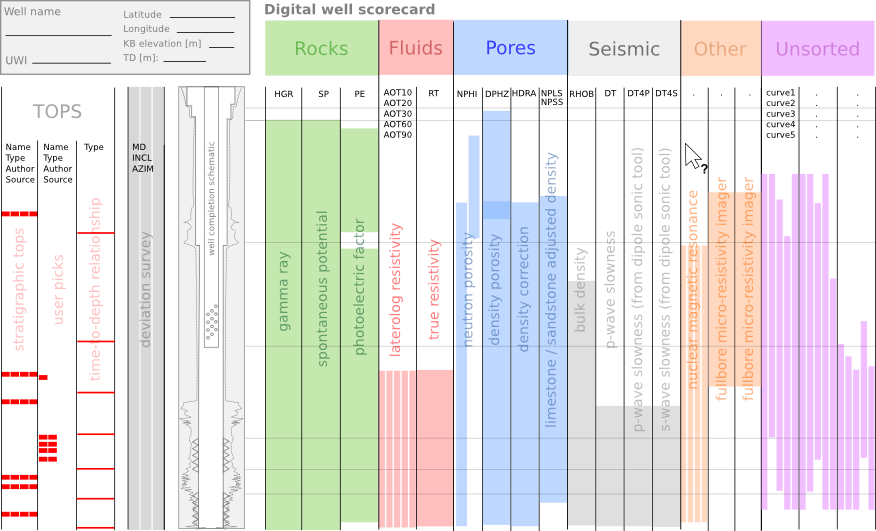
In my last post, I ranted about the soup of acronyms that refer to well log curves; a too-frequent book-keeping debacle. This pain, along with others before it, has motivated me to design a solution. At this point all I have is this sketch, a wireframe of should-be software that allows you visualize every bit of borehole data you can think of:

The goal is, show me where the data is in the domain of the wellbore. I don't want to see the data explicitly (yet), just its whereabouts in relation to all other data. Data from many disaggregated files, reports, and so on. It is part inventory, part book-keeping, part content management system. Clear the fog before the real work can begin. Because not even experienced folks can see clearly in a fog.

The scorecard doesn't yield a number or a grade point like a multiple choice test. Instead, you build up a quantitative display of your data extents. With the example shown above, I don't even have to look at the well log to tell you that you are in for a challenging well tie, with the absence of sonic measurements in the top half of the well. 

The people that I showed this to immediately undestood what was being expressed. They got it right away, so that bodes well for my preliminary sketch. Can you imagine using a tool like this, and if so, what features would you need? 

Swimming in acronym soup

In a few rare instances, an abbreviation can become so well-known that it is adopted into everyday language; more familar than the words it used to stand for. It's embarrasing, but I needed to actually look up LASER, and you might feel the same way with SONAR. These acronyms are the exception. Most are obscure barriers to entry in technical conversations. They can be constructs for wielding authority and exclusivity. Welcome to the club, if you know the password.

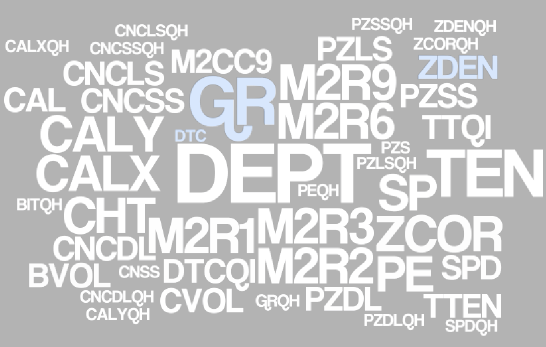
No domain of subsurface technology is riddled with more acronyms than well log analysis and formation evaluation. This is a big part of — perhaps too much of a part of — why petrophysics is hard. Last week, I came across a well. It has an extended suite of logs, and I wanted make a synthetic. Have a glance at the image and see which curve names you recognize (the size represents the frequency the names are encountered across many files of the same well).

I felt like I was being spoken to by some earlier deliquent: I got yer well logs right here buddy. Have fun sorting this mess out.

The log ASCII standard (*.LAS file) file format goes a long way to exposing descriptive information in the header. But this information is often incomplete, missing, and says nothing about the quality or completeness of the data. I had to scan 5 files to compile this soup. A micro-travesty and a failure, in my opinion. How does one turn this into meaningful information for geoscience?

Whose job is it to sort this out? The service company that collected the data? The operator that paid for it? A third party down the road?

What I need is not only an acronym look-up table, but also a data range tool to show me what I've got in the file (or files), and at which locations and depths I've got it. A database to give me more information about these acronyms would be nice too, and a feature that allows me to compare multiple files, wells, and directories at once. It would be like a life preserver. Maybe we should build it.

I made the word cloud by pasting text into wordle.net. I extracted the text from the data files using the wonderful LASReader written by Warren Weckesser. Yay, open source!

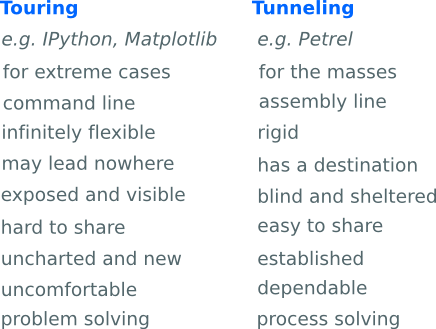
Touring vs tunnel vision

My experience with software started, and still largely sits, at the user end. More often than not, interacting with another's design. One thing I have learned from the user experience is that truly great interfaces are engineered to stay out of the way. The interface is only a skin atop the real work that software does underneath — taking inputs, applying operations, producing outputs. I'd say most users of computers don't know how to compute without an interface. I'm trying to break free from that camp. 

In The dangers of default disdain, I wrote about the power and control that the technology designer has over his users. A kind of tunnel is imposed that restricts the choices for interacting with data. And for me, maybe for you as well, the tunnel has been a welcome structure, directing my focus towards that distant point; the narrow aperture invokes at least some forward motion. I've unknowingly embraced the tunnel vision as a means of interacting without substantial choices, without risk, without wavering digressions. I think it's fair to say that without this tunnel, most travellers would find themselves stuck, incapacitated by the hard graft of touring over or around the mountain.

Tour guides instead of tunnels

But there is nothing to do inside the tunnel, no scenery to observe, just a black void between input and output. For some tasks, taking the tunnel is the only obvious and economic choice — all you want is to get stuff done. But choosing the tunnel means you will be missing things along the way. It's a trade off.

For getting from A to B, there are engineers to build tunnels, there are travellers to travel the tunnels, and there is a third kind of person altogether: tour guides take the scenic route. Building your own tunnel is a grand task, only worthwhile if you can find enough passengers to use it. The scenic route isn't just a casual lackadaisical approach. It's necessary for understanding the landscape; by taking it the traveler becomes connected with the territory. The challenge for software and technology companies is to expose people to the richness of their environment while moving them through at an acceptable pace. Is it possible to have a tunnel with windows?

Oil and gas operating companies are good at purchasing the tunnel access pass, but are not very good at building a robust set of tools to navigate the landscape of their data environment. After all, that is the thing that we travellers need to be in constant contact with. Touring or tunneling? The two approaches may or may not arrive at the same destination and they have different costs along the way, making it different business.

When to use vectors not rasters

In yesterday's post, I looked at advantages and disadvantages of various image formats. Some chat ensued in the comments and on Twitter about making drawings and figures and such. I realized I hadn't been very clear: when I say 'image', I really mean 'raster' or 'bitmap'. That is, a discretized (pixel-based) grid of data.

What are vector graphics?

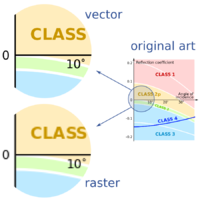
Click to enlarge — see a simulation of the difference between vector and raster art.What I was not writing about was drawings and graphics combining text, lines, and images. Such files usually contain vector graphics. Vector graphics do not contain descriptions of pixels, but instead they contain descriptions and positions of text, paths, and polygons. Example file formats are:

  • SVGScalable Vector Graphics, an open format and web standard
  • AI — a proprietary format used by Adobe Illustrator
  • CDRCorelDRAW's proprietary format
  • PPT — pictures in Microsoft PowerPoint are vector format
  • SHP — shapefiles are a (mostly) generic vector format for GIS

One of the most important properties of vector graphics is that you can rescale it without worrying about changing the resolution — as in the example (right).

What are composite formats?

Vector and raster graphics can be combined in all sorts of ways, and vector files can contain raster images. They can therefore be used for very large displays like posters. But vector files are subject to interpretation by different software, may be proprietary, and have complex features like guides and layers that you may not want to expose to someone else. So when you publish or share your work it's often a good idea to export to either a high-res PNG, or a composite page description format:

  • PDFPortable Document Format, the closest thing to an open, ubiquitous format; stable and predictable.
  • EPSEncapsulated PostScript; the precursor to PDF, it's rarely called for today, unless PDF is giving you problems.
  • PSPostScript is a programming and page description language underlying EPS and PDF; avoid it.
  • CGMComputer Graphics Metafiles are best left alone. If you are stuck with them, complain loudly.

What software do I need?

Any time you want to add text, or annotation, or anything else to a raster, or you wish to create a drawing from scratch, vector formats are the way to go. There are several tools for creating such graphics:

Judging by figures I see submitted to journals, some people use Microsoft PowerPoint for creating vector graphics. For a simple figure, this may be fine, but for anything complex — curved or wavy lines, complicated filled objects, image effects, pattern fills — it is hard work. And the drawing tools listed above have some great advantages over PowerPoint — layers, tracing, guides, proper typography, and a hundred other things.

Plus, and perhaps I'm just being a snob here, figures created in PowerPoint make it look like you just don't care. Do yourself a favour: take half a day to teach yourself to use Inkscape, and make beautiful figures for the rest of your career.

What technology?

This is my first contribution to the Accretionary Wedge geology themed community blog. Charles Carrigan over at Earth-like Planet is hosting this months topic where he posts the question, "how do you perceive technology impacting the work that you do?" My perception of technology has matured, and will likely continue to change, but here are a few ways in which technology works for us at Agile. 

My superpower

I was at a session in December where one of the activities was to come up with one (and only one) defining superpower. A comic-bookification of my identity. What is the thing that defines you? The thing that you are or will be known for? It was an awkward experience for most, a bold introspection to quickly pull out a memorable, but not too cheesy, superpower that fit our life. I contemplated my superhuman intelligence, and freakish strength... too immodest. The right choice was invisibility. That's my superpower. Transparency, WYSIWYG, nakedness, openness. And I realize now that my superpower is, not coincidentally, aligned with Agile's approach to technology. 

For some, technology is the conspicuous interface between us and our work. But conspicuous technology constrains your work, ordains it even. The real challenge is to use technology in a way that makes it invisible. Matt reminds me that how I did it isn't as important as what I did. Making the technology seem invisible means the user must be invisible as well. Ultimately, tools don't matter—they should slip away into the whitespace. Successful technology implementation is camouflaged. 

I is for iterate

Technology is not a source of ideas or insights, such as you'd find in the mind of an experienced explorationist or in a detailed cross-section or map. I'm sure you could draw a better map by hand. Technology is only a vehicle that can deliver the mind's inner constructs; it's not a replacement for vision or wisdom. Language or vocabulary has nothing to do with it. Technology is the enabler of iteration. 

So why don't we iterate more in our scientific work? Because it takes too long? Maybe that's true for a hand-drawn contour map, but technology is reducing the burden of iteration. Because we have never been taught humility? Maybe that stems from the way we learned to learn: homework assignments have exact solutions (and are done only once), and re-writing an exam is unheard of (unless you flunked it the first time around).

What about writing an exam twice to demonstrate mastery? What about reading a book twice, in two different ways? Once passively in your head, and once actively—at a slower pace, taking notes. I believe the more ways you can interact with your media, data, or content, the better work will be done. Students assume that the cost required to iterate outweighs the benefits, but that is no longer the case with digital workflows. Embracing technology's capacity to iterate seemlessly and reliably is what a makes a grand impact in our work.

What do we use?

Agile strives to be open as a matter of principle, so when it comes to software we go for open source by default. Matt wrote recently about the applications and workstations that we use.