The most important thing nobody does

A couple of weeks ago, we told you we were up to something. Today, we're excited to announce modelr.io — a new seismic forward modeling tool for interpreters and the seismically inclined.

Modelr is a web app, so it runs in the browser, on any device. You don't need permission to try it, and there's never anything to install. No licenses, no dongles, no not being able to run it at home, or on the train.

Later this week, we'll look at some of the things Modelr can do. In the meantime, please have a play with it.
Just go to modelr.io and hit Demo, or click on the screenshot below. If you like what you see, then think about signing up — the more support we get, the faster we can make it into the awesome tool we believe it can be. And tell your friends!

If you're intrigued but unconvinced, sign up for occasional news about Modelr:

This will add you to the email list for the modeling tool. We never share user details with anyone. You can unsubscribe any time.

Transforming geology into seismic

Hart (2013). ©SEG/AAPGForward modeling of seismic data is the most important workflow that nobody does.

Why is it important?

  • Communicate with your team. You know your seismic has a peak frequency of 22 Hz and your target is 15–50 m thick. Modeling can help illustrate the likely resolution limits of your data, and how much better it would be with twice the bandwidth, or half the noise.
  • Calibrate your attributes. Sure, the wells are wet, but what if they had gas in that thick sand? You can predict the effects of changing the lithology, or thickness, or porosity, or anything else, on your seismic data.
  • Calibrate your intuition. Only by predicting the seismic reponse of the geology you think you're dealing with, and comparing this with the response you actually get, can you start to get a feel for what you're really interpreting. Viz Bruce Hart's great review paper we mentioned last year (right).

Why does nobody do it?

Well, not 'nobody'. Most interpreters make 1D forward models — synthetic seismograms — as part of the well tie workflow. Model gathers are common in AVO analysis. But it's very unusual to see other 2D models, and I'm not sure I've ever seen a 3D model outside of an academic environment. Why is this, when there's so much to be gained? I don't know, but I think it has something to do with software.

  • Subsurface software is niche. So vendors are looking at a small group of users for almost any workflow, let alone one that nobody does. So the market isn't very competitive.
  • Modeling workflows aren't rocket surgery, but they are a bit tricky. There's geology, there's signal processing, there's big equations, there's rock physics. Not to mention data wrangling. Who's up for that?
  • Big companies tend to buy one or two licenses of niche software, because it tends to be expensive and there are software committees and gatekeepers to negotiate with. So no-one who needs it has access to it. So you give up and go back to drawing wedges and wavelets in PowerPoint.

Okay, I get it, how is this helping?

We've been busy lately building something we hope will help. We're really, really excited about it. It's on the web, so it runs on any device. It doesn't cost thousands of dollars. And it makes forward models...

That's all I'm saying for now. To be the first to hear when it's out, sign up for news here:

This will add you to the email list for the modeling tool. We never share user details with anyone. You can unsubscribe any time.

Seismic models: Hart, BS (2013). Whither seismic stratigraphy? Interpretation, volume 1 (1). The image is copyright of SEG and AAPG.

Wiki world of geoscience

This weekend, I noticed that there was no Wikipedia article about Harry Wheeler, one of the founders of theoretical stratigraphy. So I started one. This brings the number of biographies I've started to 3:

  • Karl Zoeppritz — described waves almost perfectly, but died at the age of 26
  • Johannes Walther — started as a biologist, but later preferred rocks
  • Harry Wheeler — if anyone has a Wheeler diagram to share, please add it!

Many biographies of notable geoscientists are still missing (there are hundreds, but here are three): 

  • Larry Sloss — another pioneer of modern stratigraphy
  • Oz Yilmaz — prolific seismic theoretician and practioner
  • Brian Russell — entrepreneur and champion of seismic analysis

It's funny, Wikipedia always seems so good — it has deep and wide content on everything imaginable. I think I must visit it 20 or 30 times a day. But when you look closely, especially at a subject you know a bit about, there are lots of gaps (I wonder if this is one of the reasons people sometimes deride it?). There is a notability requirement for biographies, but for some reason this doesn't seem to apply to athletes or celebrities. 

I was surprised the Wheeler page didn't exist, but once you start reading, there are lots of surprises:

I run a geoscience wiki, but this is intended for highly esoteric topics that probably don't really belong in Wikipedia, e.g. setting parameters for seismic autopickers, or critical reviews of subsurface software (both on my wish list). I am currently working on a wiki for AAPG — is that the place for 'deep' petroleum geoscience? I also spend time on SEG Wiki... With all these wikis, I worry that we risk spreading ourselves too thinly? What do you think?

In the meantime, can you give 10 minutes to improve a geoscience article in Wikipedia? Or perhaps you have a classful of students to unleash on an assignment?

Tomorrow, I'll tell you about an easy way to help improve some geophysics content.

Machines can read too

The energy industry has a lot of catching up to do. Humanity is faced with difficult, pressing problems in energy production and usage, yet our industry remains as secretive and proprietary as ever. One rich source of innovation we are seriously under-utilizing is the Internet. You have probably heard of it.

Machine experience design

semantic.jpg

Web sites are just the front-end of the web. Humans have particular needs when they read web pages — attractive design, clear navigation, etc. These needs are researched and described by the rapidly growing field of user experience design, often called UX. (Yes, the ways in which your intranet pages need fixing are well understood, just not by your IT department!)

But the web has a back-end too. Rather than being for human readers, the back-end is for machines. Just like human readers, machines—other computers—also have particular needs: structured data, and a way to make queries. Why do machines need to read the web? Because the web is full of data, and data makes the world go round. 

So website administrators need to think about machine experience design too. As well as providing beautiful web pages for humans to read, they should provide widely-accepted machine-readable format such as JSON or XML, and a way to make queries.

What can we do with the machine-readable web?

The beauty of the machine-readable web, sometimes called the semantic web, or Web 3.0, is that developers can build meta-services on it. For example, a website like hipmunk.com that finds the best flights, wherever they are. Or a service that provides charts, given some data or a function. Or a mobile app that knows where to get the oil price. 

In the machine-readable web, you could do things like:

  • Write a program to analyse bibliographic data from SEG, SPE and AAPG.
  • Build a mobile app to grab log mnemonics info from SLB's, HAL's, and BHI's catalogs.
  • Grab course info from AAPG, PetroSkills, and Nautilus to help people find training they need.

Most wikis have a public application programming interface, giving direct, machine-friendly access to the wiki's database. Here are two views of one wiki page — click on the images to see the pages:

At SEG last year, I suggested to a course provider that they might consider offering machine access to their course catalog—so that developers can build services that use their course information and thus send them more students. They said, "Don't worry, we're building better search tools for our users." Sigh.

In this industry, everyone wants to own their own portal, and tends to be selfish about their data and their users. The problem is that you don't know who your users are, or rather who they could be. You don't know what they will want to do with your data. If you let them, they might create unimagined value for you—as hipmunk.com does for airlines with reasonable prices, good schedules, and in-flight Wi-Fi. 

I can't wait for the Internet revolution to hit this industry. I just hope I'm still alive.

Cope don't fix

Some things genuinely are broken. International financial practices. Intellectual property law. Most well tie software. 

But some things are the way they are because that's how people like them. People don't like sharing files, so they stash their own. Result: shared-drive cancer — no, it's not just your shared drive that looks that way. The internet is similarly wild, chaotic, and wonderful — but no-one uses Yahoo! Directory to find stuff. When chaos is inevitable, the only way to cope is fast, effective search

So how shall we deal with the chaos of well log names? There are tens of thousands — someone at Schlumberger told me last week that they alone have over 50,000 curve and tool names. But these names weren't dreamt up to confound the geologist and petrophysicist — they reflect decades of tool development and innovation. There is meaning in the morasse.

Standards are doomed

Twelve years ago POSC had a go at organizing everything. I don't know for sure what became of the effort, but I think it died. Most attempts at standardization are doomed. Standards are awash with compromise, so they aren't perfect for anything. And they can't keep up with changes in technology, because they take years to change. Doomed.

Instead of trying to fix the chaos, cope with it.

A search tool for log names

We need a search tool for log names. Here are some features it should have:

  • It should be free, easy to use, and fast
  • It should contain every log and every tool from every formation evaluation company
  • It should provide human- and machine-readable output to make it more versatile
  • You should get a result for every search, never drawing a blank
  • Results should include lots of information about the curve or tool, and links to more details
  • Users should be able to flag or even fix problems, errors, and missing entries in the database

To my knowledge, there are only two tools a little like this: Schlumberger's Curve Mnemonic Dictionary, and the SPWLA's Mnemonics Data Search. Schlumberger's widget only includes their tools, naturally. The SPWLA database does at least include curves from Baker Hughes and Halliburton, but it's at least 10 years out of date. Both fail if the search term is not found. And they don't provide machine-readable output, only HTML tables, so it's difficult to build a service on them.

Introducing fuzzyLAS

We don't know how to solve this problem, but we're making a start. We have compiled a database containing 31,000 curve names, and a simple interface and web API for fuzzily searching it. Our tool is called fuzzyLAS. If you'd like to try it out, please get in touch. We'd especially like to hear from you if you often struggle with rogue curve mnemonics. Help us build something useful for our community.

News of the month

News from the interface between the infinite istropic half-spaces of geoscience and technology. Got tips? 

Matt was at the SEG Annual Meeting in Las Vegas at the beginning of the month. If you didn't make the trip, and even if you did, Don't miss his highlights posts.

Webapp for wells

This is exciting. Subsurfr could be the start of a much-needed and long-overdue wave of rapid web innovation for petrotechnical tools. Much kudos to tiny Wellstorm Development for the bold initiative; it makes you wonder what on earth Halliburton and Schlumberger are up to. Right from your browser, you can fly around the subsurface of North Dakota, see logs, add picks, build surface segments, and provide the creators with feedback. Try it out!

OpendTect gets even awesomer 

OpendTect goes from strength to strength, having passed 100 000 downloads on about 11 November. If you haven't tried it yet, you really should. It's like all those other integrated volume interpretation tools, with the small difference that it's open source-you can read the code. Oh, and it's free. There is that.

Paul de Groot, one of the founders of dGB, told me at SEG that he's been tinkering with code again. He's implemented GLCM-based texture attributes, and it will be in the open source base package soon. Nice.

The next big thing

Landmark's PowerCalculator was good. Geocraft was awesome. Now there's Canopy - Enthought's attempt to bring Python coding to the rest of us. The idea is to provide a MATLAB-like environment for the galaxy of mathematical and scientific computing packs for Python (numpy, scipy, matplotlib, to name a few). It's in beta right now — why not ask for an invite? Even more exiciting for geophysicists — Enthought is developing a set of geoscience plugins, allowing you to load SEGY data, display seismic, and perform other nifty tricks. Can't wait.

More Nova Scotia exploration

BP won licenses in the latest offshore exploration round (NS12–1), in exchange for a $1.05 billion work bid on 4 deep water parcels. This is in line with Shell's winning bid last January of $970 million, and they also added to their acreage — it seems there's an exploration renaissance happening in Nova Scotia. After the award, there were lots of questions about BP's safety record, but the licensing rules only allow for the highest bidder to win — there's no scrutiny of suitability at this stage. Awarding the license and later denying the right to drill seems a bit disingenuous, however. Water depth: up to about 3500 m!

This regular news feature is for information only. We aren't connected with any of these organizations, and don't necessarily endorse their products or services. Except OpendTect and Canopy, because they are awesome and we use them almost every day.

News of the week

Some news from the last fortnight or so. Things seem to be getting going again after the winter break. If you see anything you think our readers would be interested in, please get in touch

Shale education

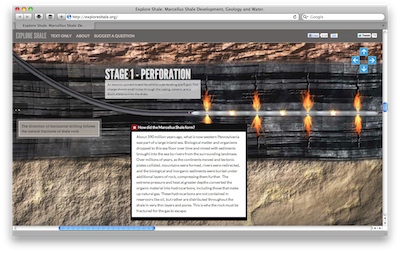
Penn State University have put together an interactive infographic on the Marcellus Shale development in Pennsylvania. My first impression was that it was pro-industry. On reflection, I think it's quite objective, if idealized. As an industry, we need to get away from claims like "fracking fluid is 99% water" and "shale gas developments cover only 0.05% of the state". They may be true, but they don't give the whole story. Attractive, solid websites like this can be part of fixing this.

New technology

This week all the technlogy news has come from the Consumer Electronics Show in Las Vegas. It's mostly about tablets this year, it seems. Seems reasonable—we have been seeing them everywhere recently, even in the workplace. Indeed, the rumour is that Schlumberger is buying lots of iPads for field staff.

So what's new in tech? Well, one company has conjured up a 10-finger multi-touch display, bringing the famous Minority Report dream a step closer. I want one of these augmented reality monocles. Maybe we will no longer have to choose between paper and digital!

Geophysical magic?

tiny press story piqued our interest. Who can resist the lure of Quantum Resonance Interferometry? Well, apparently some people can, because ViaLogy has yet to turn a profit, but we were intrigued. What is QRI? ViaLogy's website is not the most enlightening source of information—they really need some pictures!—but they seem to be inferring signal from subtle changes in noise. In our opinion, a little more openness might build trust and help their business. 

New things to read

Sometimes we check out the new and forthcoming books in Amazon. Notwithstanding their nonsensical prices, a few caught our eye this week:

Detect and Deter: Can Countries Verify the Nuclear Test Ban? Dahlman, et al, December 2011, Springer, 281 pages, $129. I've been interested in nuclear test monitoring since reading about the seismic insights of Tukey, Bogert, and others at Bell Labs in the 1960s. There's geophysics, nuclear physics and politics in here.

Deepwater Petroleum Exploration & Production: A Nontechnical Guide Leffler, et al, October 2011, Pennwell, 275 pages, $79. This is the second edition of this book by ex-Shell engineer Bill Leffler, aimed at a broad industry audience. There are new chapters on geoscience, according to the blurb.

Petrophysics: Theory and Practice of Measuring Reservoir Rock and Fluid Transport Properties Tiab and Donaldson, November 2011, Gulf Professional Publishing, 971 pages, $180. A five-star book at Amazon, this outrageously priced book is now in its third edition.

This regular news feature is for information only. We aren't connected with any of these organizations, and don't necessarily endorse their products or services. Low-res images of book and website considered fair use.