A machine learning safety net

A while back, I wrote about machine learning safety measures. I was thinking about how easy it is to accidentally make terrible models (e.g. training a support vector machine on unscaled data), or misuse good models (e.g. forgetting to scale data before making a prediction). I suggested that one solution might be to make tools that help spot these kinds of mistakes:

[We should build] software to support good practice. Many of the problems I’m talking about are quite easy to catch, or at least warn about, during the training and evaluation process. Unscaled features, class imbalance, correlated features, non-IID records, and so on. Education is essential, but software can help us notice and act on them.

Introducing redflag

I’m pleased, and a bit nervous, to introduce redflag, a new Python library to help find the sorts of issues I’m describing. The vision for this tool is as a kind of safety net, or ‘entrance exam for data’ (a phrase Evan coined several years ago). It should be able to look at an array (or Pandas DataFrame), and flag potential issues, perhaps generating a report. And it should be able to sit in your Scikit-Learn pipeline, watching for issues.

The current version, 0.1.9 is still rather rough and experimental. The code is far from optimal, with quite a bit of repetition. But it does a few useful things. For example, suppose we have a DataFrame with a column, Lithology, which contains strings denoting 9 rock types (‘sandstone’, ‘limestone’, etc). We’d like to know if the classes are ‘balanced’ — present in roughly similar numbers — or not. If they are not, we will have to be careful with how we split this dataset up for our model evaluation workflow.

>>> import redflag as rf
>>> rf.imbalance_degree(df['Lithology'])
3.37859304086633
>>> rf.imbalance_ratio([df['Lithology'])
8.347368421052632

The imbalance degree, defined by Ortigosa-Hernandez et al. (2017), tells us that there are 4 minority classes (the next integer above this number), and that the imbalance severity is somewhere in the middle (3.1 would be well balanced, 3.9 would be strongly imbalanced). The simpler imbalance ratio tells us that there’s about 8 times as much of the biggest majority class as of the smallest minority class. Conclusion: depending on the size of this dataset, the class imbalance is probably not a show-stopper, but we need to pay attention.

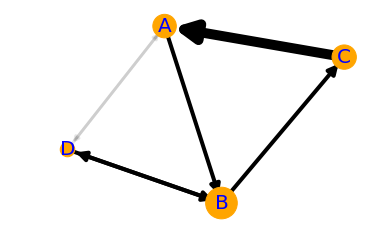
Our dataset contains well log data. Unless they are very far apart, well log samples are usually not independent — they are correlated in depth — and this means we can’t split the data randomly in our evaluation workflow. Redflag has a function to help detect features that are correlated to themselves in this way:

>>> rf.is_correlated(df['GR'])
True

We need to be careful!

Another function, rf.wasserstein() computes the Wasserstein distance, aka the earth mover’s distance, between distributions. This can help us figure out if our data splits all have similar distributions or not — an important condition of our evaluation workflow. I’ll feed it 3 splits in which I have forgotten to scale the first feature (i.e. the first column) in the X_test dataset:

>>> rf.wasserstein([X_train, X_val, X_test])
array([[32.108,  0.025,  0.043,  0.034],
       [16.011,  0.025,  0.039,  0.057],
       [64.127,  0.049,  0.056,  0.04 ]])

The large distances in the first column are the clue that the distribution of the data in this column varies a great deal between the three datasets. Plotting the distributions make it clear what happened.

Working with sklearn

Since we’re often already working with scikit-learn pipelines, and because I don’t really want to have to remember all these extra steps and functions, I thought it would be useful to make a special redflag pipeline that runs “all the things”. It’s called rf.pipeline and it might be all you need. Here’s how to use it:

from sklearn.pipeline import make_pipeline
from sklearn.preprocessing import StandardScaler
from sklearn.svm import SVC

pipe = make_pipeline(StandardScaler(), rf.pipeline, SVC())

Here’s what this object contains:

Pipeline(steps=[('standardscaler', StandardScaler()),
                ('pipeline',
                 Pipeline(steps=[('rf.imbalance', ImbalanceDetector()),
                                 ('rf.clip', ClipDetector()),
                                 ('rf.correlation', CorrelationDetector()),
                                 ('rf.outlier', OutlierDetector()),
                                 ('rf.distributions',
                                  DistributionComparator())])),
                ('svc', SVC())])

Those redflag items in the inner pipeline are just detectors — think of them like smoke alarms — they do not change any data. Some of them acquire statistics during model fitting, then apply them during prediction. For example, the DistributionComparator learns the feature distributions from the training data, then compares the prediction data to them, to help ensure that you aren’t trying to extrapolate with your model. For example, it will warn you if you train a model on low-GR sandstones then try to predict on high-GR shales.

Here’s what happens when I fit my data with this pipeline:

These are just warnings, and it’s up to me to act on them. I can adjust detection thresholds and other aspects of the algorithms under the hood, but the goal is for redflag to wave its little flag, but not to get in the way. Apart from the warnings, this pipeline works exactly as it did before.


If this project sounds interesting or useful to you, please give it a look. The documentation is here, and contains more examples like those above. If you find bugs or want to request enhancements, there’s the GitHub Issues page. And if you use it for anything you can share, I’d love to hear how you get along!

Love Python and seismic? You need xarray

If you use Python on a regular basis, you might have noticed that Pandas is eating everything, not just things made out of bamboo.

But one thing Pandas is not useful for is 2-D or 3-D (or more-D) seismic data. Its DataFrames are implicitly two-dimensional tables, and shine when the columns represent all sorts of different quantities, e.g. different well logs. But, the really powerful thing about a DataFrame is its index. Instead of having row 0, row 1, etc, we can use an index that makes sense for the data. For example, we can use depth for the index and have row 13.1400 and row 13.2924, etc. Much easier than trying to figure out which index goes with 13.1400 metres!

Seismic data, on the other hand, does not fit comfortably in a table. But it would certainly be convenient to have real-world coordinates for the data as well as NumPy indices — maybe inline and crossline numbers, or (UTMx, UTMy) position, or the actual time position of the timeslices in milliseconds. With xarray we can.

In essence, xarray brings you Pandas-like indexing for n-dimensional arrays. Let’s see why this is useful.

Make an xarray.DataArray

The DataArray object is analogous to a NumPy array, but with the Pandas-like indexing added to each dimension via a property called coords. Furthermore, each dimension has a name.

Imagine we have a seismic volume called seismic with shape (inlines, xlines, time) and the inlines and crosslines are both numbered like 1000, 1001, 1002, etc. The time samples are 4 ms apart. All we need is an array of numbers representing inlines, another for the xlines, and another for the time samples. Then we can construct the DataArray like so:

 
import xarray as xr

il, xl, ts = seismic.shape  # seismic is a NumPy array.

inlines = np.arange(il) + 1000
xlines = np.arange(xl) + 1000
time = np.arange(ts) * 0.004

da = xr.DataArray(seismic,
                  name='amplitude',
                  coords=[inlines, xlines, time],
                  dims=['inline', 'xline', 'twt'],
                  )

This object da has some nice superpowers. For example, we can visualize the timeslice at 400 ms with a single line:

da.sel(twt=0.400).plot()

to produce this plot:

Plotting the same thing from the NumPy array would require us to figure out which index corresponds to 400 ms, and then write at least 8 lines of matplotlib code. Nice!

What else?

Why else might we prefer this data structure over a simple NumPy array? Here are some reasons:

  • Extracting amplitude (or whatever) on a horizon. In particular, if the horizon is another DataArray with the same dims as the volume, this is a piece of cake.

  • Extracting amplitude along a wellbore (again, use the same dims for the well path).

  • Making an arbitrary line (a view not aligned with the rows/columns) is easier, because interpolation is ‘free’ with xarray.

  • Exchanging data with Pandas DataFrame objects is easy, making reading from certain formats (e.g. OpendTect horizon export, which gives you inline, xline coords, not a grid) much easier. Even better: use our library gio for this! It makes xarray objects for you.

  • If you have multiple attributes, then xarray.Dataset is a nice data structure to keep things straight. You can think of it as a dictionary of DataArray objects, but it’s a lot more than that.

  • You can store arbitrary metadata in xarray objects, so it’s easy to attach things you’d like to retain like data rights and permissions, seismic attribute parameters, data acquisition details, and so on.

  • Adding more dimensions is easy, e.g. offset or frequency, because you can just add more dims and associated coords. It can get hard to keep these straight in NumPy (was time on the 3rd or 4th axis?).

  • Taking advantage of Dask, which gives you access to parallel processing and out-of-core operations.

All in all, definitely worth a look for anyone who uses NumPy arrays to represent data with real-world coordinates.


Do you already use xarray? What kind of data does it help you with? What are your reasons? Did I miss anything from my list? Let us know in the comments!

More ways to make models

A few weeks ago I wrote about a new feature in bruges for making wedge models. This new feature makes it really easy to make wedge models, for example:

 
import bruges as bg import matplotlib.pyplot as plt strat = [(0, 1, 0), (2, 3, 2, 3, 2), (4, 5, 4)] wedge, *_ = bg.models.wedge(strat=strat, conformance=’top’) plt.imshow(wedge)

And here are some examples of what this will produce, depending on the conformance argument:

wedge_conformance.png

What’s new

I thought it might be interesting to be able to add another dimension to the wedge model — in and out of the screen in the models shown above. In that new dimension — as long as there are only two rock types in there — we could vary the “net:gross” of the wedge.

So if we have two rock types in the wedge, let’s say 2 and 3 as in the wedges shown above, we’ll end up with a lot of different wedges. At one end of the new dimension, we’ll have a wedge that is all 2. At the other end, it’ll be all 3. And in between, there’ll be a mixture of 2 and 3, with the layers interfingering in a geometrically symmetric way.

Let’s look at those 3 slices in the central model shown above:

bruges_wedge_slices.png

We can also see slices in that other dimension, to visualize the net:gross variance across the model. These slices are near the thin end of the wedge, the middle, and the thick end:

bruges_netgross_slices.png

To get 3D wedge models like this, just make a binary (2-component) wedge and add breadth=100 (the number of slices in the new dimension).

These models are admittedly a little mind-bending. Here’s what slices in all 3 orthogonal directions look like, along with (very badly) simulated seismic through this 3D wedge model:

bruges_all_the_slices.png

New wedge shapes!

As well as the net-to-gross thing, I added some new wedge shapes, so now you can have some steep-sided alternatives to the linear and sigmoidal ramps I had in there originally. In fact, you can pass in a wedge shape function of your own, so there’s no end to what you could implement.

bruges_new_wedge_shapes.png

You can read about these new features in this notebook. Please note that you will need the latest version of bruges to use these new features, so run pip install —upgrade bruges in your environment, then you’ll be all set. Share your models, I’d love to see what you make!

Survival of the fittest or overcrowding?

If you’ve been involved in drilling boreholes in your career, you’ll be familiar with desurvey. Desurvey is the process of converting a directional well survey — which provides measured depth, inclination and azimuth points from the borehole — into a position log. The position log is an arbitrarily finely sampled set of (x, y, z) points along the wellbore. We need this to convert from measured depth (distance along the borehole path) to depth in the earth, which is usually given relative to mean sea-level.

I hunted around recently and found no fewer than nine Python packages that contain desurvey code. They are of various vintages and licences:

Other larger tools that contain desurvey code but not as re-usable

This is amazing — look at all the activity in the last 2 years or so! I think this is a strong sign that we've hit a new era in geocomputing. Fifteen years ago a big chunk of the open source geoscience stuff out there was the ten-or-so seismic processing libraries. Then about 7 or 8 years ago there was a proliferation of geophysical modeling and inversion tools. Now perhaps we're seeing the geological and wells communities entering the same stage of evolution. This is encouraging.

What now?

But there’s a problem here too. — this is a small community, with limited resources. Can we afford this diversity? I accept that there might be a sort of Cambrian explosion event that has to happen with new technology. But how can we ensure that it results in an advantageous “survival of the fittest” ecology, and avoid it becoming just another way for the community to spread itself too thinly? To put it another way, how can we accelerate the evolutionary process, so that we don’t drain the ecosystem of valuable resources?

There’s also the problem of how to know which of these tools is the fittest. As far as I’m aware, there are no well trajectory benchmarks to compare against. Some of the libraries I listed above do not have rigorous tests, certainly they all have bugs (it’s software) — how can we ensure quality emerges from this amazing pool of technology?

I don’t know, but I think this is a soluble problem. We’ve done the hard part! Nine times :D


swung_round_135px.png

There was another sign of subsurface technology maturity in the TRANSFORM conference this year. Several of the tutorials and hackathon projects were focused on integrating tools like GemPy, Devito, segyio, and the lasio/welly/striplog family. This is exciting to see — 2021 could be an important year in the history of the open subsurface Python stack. Stay tuned!

A forensic audit of seismic data

The SEG-Y “standard” is famously non-standard. (Those air quotes are actually part of the “standard”.)

For example, the inline and crossline location of a given trace — two things that you must have in order to load the data vaguely properly — are “recommended” (remember, it’s a “standard”) to be given in the trace’s header, at byte locations 189 and 193 respectively. Indeed, they might well be there. Or 1 and 5 (well, 5 or 9). Or somewhere else. Or not there at all.

Don Robinson at Resolve told me recently that he has seen more than 180 byte-location combinations, and he said another service company had seen more than 300.

All this can make loading seismic data really, really annoying.

I’d like to propose that the community performs a kind of forensic audit of SEG-Y files. I have 5 main questions:

  1. What proportion of files claim to be Rev 0, Rev 1, and Rev 2? And what standard are they actually? (If any!)

  2. What proportion of files in the wild use IBM vs IEEE floats? What about integers?

  3. What proportion of files in the wild use little-endian vs big-endian byte order. (Please tell me there's no middle-endian data out there!)

  4. What proportion of files in the wild use EBCDIC vs ASCII encoded textual file headers? (Again, I would hope there are no other encodings in use, but I bet there are.)

  5. What proportion of files use the Strongly recommended and Recommended byte locations for trace numbers, sample counts, sample interval, coordinates and inline–crossline numbers?

For each of these <things> it would also be interesting to know:

  • How does <thing> vary with the other things? That is, what's the cross-correlation matrix?

  • How does <thing> vary with the age of the file? Is there a temporal trend?

  • How does <thing> vary with the provenance of the file? What's the geographic trend? (For example, Don told me that the prevalence of PC-based interpretation packages in Canada led to widespread early adoption of IEEE floats and little-endian byte order; indeed, he says that 90% of the SEG-Y he sees in the wild is still IBM ormatted floats!)

While we’re at it, I'd also like in some more esoteric things:

  • How many files have cornerpoints in the text header, and/or trace locations in trace headers?

  • How many files have an unambiguous CRS in the text header?

  • How many files have information about the processing sequence in the text header? (E.g. imaging details, filters, etc.)

  • How many files have incorrect information in the headers (e.g. locations, sample interval, byte format, etc)

  • How many processors bother putting useful things like elevation, filters, sweeps, fold at target, etc, in the trace headers?

I don’t quite know how such a survey would happen. Most of these things are obviously detectable from the files themselves. Perhaps some of the many seismic data management systems already track these things. Or maybe you’re a data manager and you have some anecdotal data you can share.

What do you think? I’d love to hear your thoughts in the comments. Maybe there’s a good hackathon project here!

Stratigraphic interpretation

Over the weekend, Lisa Stright posted a question on the Software Underground’s Slack:

[… W]hat are you favorite seismic attributes for analyzing subtle stratigraphic changes in vertical sections (not time or strata slices)? I’m trying to quantitatively analyze sedimentological information from seismic data and am curious about either best practices and/or useful approaches in reservoir geophysics.

I really like questions like this, because they tend to bring out a lot of useful tricks and ideas from the community. However, my own response turned into a bit of a wall of text, so I thought I’d unpack it a bit here, with some links and detail.

I’ll start with the general advice for any reservoir seismic interpretation:

  1. Before trying any interpretation that relies on reflector patterns, it’s crucial to make sure the phase is good. There are two really good papers to read on phase determination: Roden & Sepulveda (1999) and Perz, Sacchi and O’Byrne (2004). I summarized this in the SubSurfWiki article on phase determination. (Note to self: it would be fun to write a tool to semi-automate some of these tests.)

  2. Always use at least 16-bit, unfiltered data for attributes. If you’re having data processed, it’s important to ask for unfiltered data, because in my experience most processors just can’t help themselves.

  3. If using marine data, it's imperative that you know where to expect multiples because they can create convincing pinch out etc. Make integer multiples of the seafloor to help predict — and there are lots of other horizons you could make.

  4. You need to know the tuning thickness for the interval of interest. You can compute it with the uppermost frequency, \(f_\mathrm{max}\) (the frequency when the normalized power hites –20 dB down) and velocity \(v\) as \(v / 4f_\mathrm{max}\) (n.b. spatial resolution is \(v / 2f_\mathrm{max}\)). Amplitudes that you can interpret as tuning effect might help you spot thickness variations in thin beds near and below seismic resolution.

As for the attributes, I've never got on with fancy 'pattern' attributes like parallelism, although it is different from anything else. Plenty of experienced interpreters mention cosine of phase too, but again I don’t recall having used it on the battlefield; perhaps I’m missing out, or maybe my data’s just never been suitable.

Instead, here are the ones I tend to go for:

  1. Integrated trace is the most under-appreciated attribute, in my opinion. It is sometimes called relative acoustic impedance and is incredibly cheap to compute.

  2. Semblance is a genuinely different view of your data, at least in stratal slices. (I realize now that Lisa explicitly said she wasn’t interested in stratal horizontal attributes, but I‘ll leave it in for completeness Same for the next one…)

  3. Spectral decomposition is a good tool if done carefully, again in stratal slices. Stick to the band of your data though.

By the way, before doing anything important with attributes, read everything you can by Art Barnes, starting with Too many seismic attributes? (Barnes 2006). TL;DR — he says there are only 10 you need to know about.

Advice from other interpreters

Art Barnes isn’t the only one with good advice to offer!

In the same Slack thread, Steve Purves (who wrote a nice Geophysical Tutorial about phase) mentioned the awesome PyLops tutorial on coloured inversion (PyLops is a linear operator package from Equinor). And Rob G also pointed out the merits of inversion for stratigraphic interpretation. (With the added bonus that you don’t need absolute impedance from it, so a lot of the usual inversion challenges, like low-frequency models, aren’t quite as critical).

Rob G also had this awesome advice:

I would also have a look at the amplitude-frequency spectrum of your seismic data compare it to the spectra of your well acoustic impedance logs (in your AOI). Then consider doing some spectral shaping to enhance the higher frequencies in the seismic to match the well logs (spectral blueing). This should allow you to see more details, however you have to be very careful to ensure you are not over boosting the higher frequencies which contain more noise than signal.

Finally, Doug McClymont, who I know from several events in the UK to be a wise geophysicist, underscored the usefulness of both the ‘instantaneous phase of the peak envelope’ and the ‘phase rotation with the highest amplitude’ methods, especially when well ties are prone to unresolvable time shift residuals. Great advice.

As the Software Underground continues to evolve, these are the conversations that keep it awesome.


References

  • Barnes, A (2006). Too many seismic attributes? CESG Recorder 31 (3). Available online.

  • Perz, M, M Sacchi and A O'Byrne (2004). Instantaneous phase and the detection of lateral wavelet stability. The Leading Edge 23 (7), 639–643. DOI 10.1190/1.1776731.

  • Purves, S (2014). Geophysical Tutorial: Phase and the Hilbert transform. The Leading Edge 33, p 1164–1166. DOI 10.1190/tle33101164.1

  • Roden, R and H Sepulveda (1999). The significance of phase to the interpreter; practical guidelines for phase analysis The Leading Edge 18 (7), p. 774–777. DOI 10.1190/1.1438375

The order of stratigraphic sequences

Much of stratigraphic interpretation depends on a simple idea:

Depositional environments that are adjacent in a geographic sense (like the shoreface and the beach, or a tidal channel and tidal mudflats) are adjacent in a stratigraphic sense, unless separated by an unconformity.

Usually, geologists are faced with only the stratigraphic picture, and are challenged with reconstructing the geographic picture.

One interpretation strategy might be to look at which rocks tend to occur together in the stratigraphy. The idea is that rock types tend to be associated with geographic environments — maybe fine sand on the shoreface, coarse sand on the beach; massive silt in the tidal channel, rhythmically laminated mud in the mud-flats. Since if two rocks tend to occur together, their environments were probably adjacent, we can start to understand associations between the rock types, and thus piece together the geographic picture.

So which rock types tend to occur together, and which juxtapositions are spurious — perhaps the result of allocyclic mechanisms like changes in relative sea-level, or sediment supply? To get at this question, some stratigraphers turn to Markov chain analysis.

What is a Markov chain?

Markov chains are sequences of events, or states, resulting from a Markov process. Here’s how Wikipedia describes a Markov process:

A stochastic process that satisfies the Markov property (sometimes characterized as “memorylessness”). Roughly speaking, a process satisfies the Markov property if one can make predictions for the future of the process based solely on its present state just as well as one could knowing the process’s full history, hence independently from such history; i.e., conditional on the present state of the system, its future and past states are independent.

So if we believe that a stratigraphic sequence (I’m using ‘sequence’ here in the most general sense) can be modeled by a process like this — i.e. that its next state depends substantially on its present state — then perhaps we can model it as a Markov chain.

For example, we might have a hunch that we can model a shallow marine system as a sequence like:

offshore mudstone > lower shoreface siltstone > upper shoreface sandstone > foreshore sandstone

Then we might expect to see these transitions occur more often than other, non-successive transitions. In other words — if we compare the transition frequencies we observe to the transition frquencies we would expect from a random sequence of the same beds in the same proportions, then autocyclic or genetic transitions might happen unusually frequently.

The Powers & Easterling method

Several workers have gone down this path. The standard approach seems to be that of Powers & Easterling (1982). Here are the steps they describe:

  • Count the upwards transitions for each rock type. This results in a matrix of counts. Here’s the transition frequency matrix for the example used in the Powers & Easterling paper, in turn taken from Gingerich (1969):

 
data = [[ 0, 37,  3,  2],
        [21,  0, 41, 14],
        [20, 25,  0,  0],
        [ 1, 14,  1,  0]]
  • Compute the expected counts by an iterative process, which usually converges in a few steps. The expected counts represent what Goodman (1968) called a ‘quasi-independence’ model — a random sequence:

 
array([[ 0. , 31.3,  8.2,  2.6],
       [31.3,  0. , 34.1, 10.7],
       [ 8.2, 34. ,  0. ,  2.8],
       [ 2.6, 10.7,  2.8,  0. ]])
  • Now we can compare our observed frequencies with the expected ones in two ways. First, we can inspect the \(\chi^2\) statistic, and compare it with the \(\chi^2\) distribution, given the degrees of freedom (5 in this case). In this example, it’s 35.7, which is beyond the 99.999th percentile of the chi-squared distribution. This rejects the hypothesis of quasi-independence. In other words: the succession appears to be organized. Phew!

  • Secondly, we can compute a matrix of so-called normalized differences. This lets us compare the observed and expected data. By calculating Z-scores, which are approximately normally distributed; since 95% of the distribution falls between −2 and +2, any value greater in magnitude than 2 is ‘fairly unusual’, in the words of Powers & Easterling. In the example, we can see that the large number of transitions from C (third row) to A (first column) is anomalous:


array([[ 0. ,  1. , -1.8, -0.3],
       [-1.8,  0. ,  1.2,  1. ],
       [ 4.1, -1.6,  0. , -1.7],
       [-1. ,  1. , -1.1,  0. ]])
powers_easterling_normdiff.png
  • The normalized difference matrix can also be interpreted as a directed graph, indicating the ‘strengths’ of the connections (edges) between rock types (nodes):

powers_easterling_graph.png

It would be all too easy to over-interpret this graph — B and D seem to go together, as do A and C, and C tends to pass into A, which tends to pass into a B/D system before passing back into C — and one could get carried away. But as a complement to sedimentological interpretation, knowledge of processes and the succession in hand, perhaps inspecting Markov chains can help understand the stratigraphic story.

One last thing… there is another use for Markov chains. We can also use the model to produce stochastic realizations of stratigraphy. These will share the same statistics as the original data, but are otherwise quite random. Here are 20 random beds generated from our model:

 
'ABABCBABABCABDABABCA'

The code to build your own Markov chains is all in this notebook. It’s very much a work in progress. Eventually I hope to merge it into the striplog library, but for now it’s a ‘minimum viable product’. Stay tuned for more on striplog.

Open In Colab   ⇐   Launch the notebook right here in your browser!


References

Gingerich, PD (1969). Markov analysis of cyclic alluvial sediments. Journal of Sedimentary Petrology, 39, p. 330-332. https://doi.org/10.1306/74D71C4E-2B21-11D7-8648000102C1865D

Goodman, LA (1968), The analysis of cross-classified data: independence, quasi-independence, and interactions in contingency tables with or without missing entries. Journal of American Statistical Association 63, p. 1091-1131. https://doi.org/10.2307/2285873

Powers, DW and RG Easterling (1982). Improved methodology for using embedded Markov chains to describe cyclical sediments. Journal of Sedimentary Petrology 52 (3), p. 0913-0923. https://doi.org/10.1306/212F808F-2B24-11D7-8648000102C1865D

The right writing tools

Scientists write, it's part of the job. If writing feels laborious, it might be because you haven't found the right tools yet. 

The wrong tools <cough>Word</cough> feel like a lot of work. You spend a lot of time fiddling with font sizes and not being sure whether to use italic or bold. You're constantly renumbering sections after edits. Everything moves around when you resize a figure. Tables are a headache. Table of contents? LOL.

If this sounds familiar, check out the following tools — arranged more or less in order of complexity.

Markdown

If you've never experienced writing with a markup language, you're in for a treat. At first it might feel clunky, but it quickly gets out of the way, leaving you to focus on the writing. Markdown was invented by John Gruber in about 2004; it is now almost ubiquitous in tools for developers. It's very lightweight, but compatible with HTML and LaTeX math, so it has plenty of features. Styling is absent from the document itself, being applied enitrely in post-production, as it were. With help from pandoc, you can compile Markdown documents to almost any format (e.g. PDF or Word). As a result, Markdown is sufficient for at least 70% of my writing projects. Here's a sampling of Markdown markup, rendered on the right with no styling:

Markdown_raw.png
Markdown_render.png

Jupyter Notebook

If you've been following along with our X Lines of Python series, or any of our other code-centric content, you'll have come across Jupyter Notebooks. These documents combine Markdown with code (in more or less any language you can think of) and the outputs of code — data, charts, images, etc. More than containing code, a so-called kernel can also run the code: Notebooks are fully computable documents. Not only could you write a paper or book in a Notebook, many people use them to give presentations with fully interactive, live code blocks and widgets.

Notebook_example.png
latex_folder___by_missyobo-d3azzbh.png

LaTeX

I discovered LaTeX in about 1993 and it was love at first sight. I've always been a bit of a typography nerd, and LaTeX — like TeX, around which LaTeX is wrapped — really cares about typography. So you get ligatures, hyphenation, sentence spacing, and kerning for free. It also cares about mathematics, cross-references, bibliographies, page numbering, tables of contents, and everything else you need for publication-ready documents.

You can install LaTeX locally, but there are several ways to use LaTeX online, without installing anything — and you get the best of both worlds: markup with WYSIWYG editing. OverleafShareLaTex (which is merging with Overleaf), Authorea, and Papeeria are all worth a look, especially if you write scientific papers.

When WYSISYG works

Sometimes you just want a couple of headings and some text, or you need to share a document with others. I often go for WYSISYG in those situations too — Google Docs is the best WYSIWYG editor I've used. When it supports Markdown too, which is surely only a matter of time, it will be perfect.

What about you, do you have a favourite writing tool? Share it in the comments.

Digitalization... of what?

I've been hearing a lot about 'digitalization', or 'digital transformation', recently. What is this buzzword?

The general idea seems to be: exploit lots and lots of data (which we already have), with analytics and machine learning probably, to do a better job finding and producing fuel and energy safely and responsibly.

At the centre of it all is usually data. Lots of data, usually in a lake. And this is where it all goes wrong. Digitalization is not about data. And it's not about technology either. Or cloud. Or IoT.

Interest in the terms "digital transformation" and "digitalization" since 2004, according to Google Trends. The data reveal a slight preference for the term "digitalization" in central and northern Europe. Google Ngram Viewer&nbsp;indicates that the…

Interest in the terms "digital transformation" and "digitalization" since 2004, according to Google Trends. The data reveal a slight preference for the term "digitalization" in central and northern Europe. Google Ngram Viewer indicates that the term "digitalization" has been around for over 100 years, but it is also a medical term connected with the therapeutic use of digitalis. Just to be clear, that's not what we're talking about.

It's about people

Oh no, here I go with the hand-wavy, apple-pie "people not process" nonsense... well, yes. I'm convinced that it's humans we're transforming, not data or technology. Or clouds. Or Things.

I think it's worth spelling out, because I think most corporations have not grasped the human aspect yet. And I don't think it's unreasonable to say that petroleum has a track record of not putting people at the centre of its activities, so I worry that this will happen again. This would be bad, because it might mean that digitalization not only fails to get traction — which would be bad enough because this revolution is long overdue — but also that it causes unintended problems.

Without people, digital transformation is just another top-down 'push' effort, with too much emphasis on supply. I think it's smarter to create demand, or 'pull', so that professionals are asking for support, and tools, and databases, and are engaged in how those things are created.

Put technical professionals at the heart of the revolution, and the rest will follow. The inverse is not true.

Strategies

This is far from an exhaustive list, but here are some ideas for ways to get ahead in digital transformation:

  • Make it easy for digitally curious people to dip a toe in. Build a beginner-friendly computing environment, and encourage people to use it. Challenge your IT people to support a culture of experimentation and creativity. 
  • Give those curious professionals access to professional development channels, whether it's our courses, other courses, online channels like Lynda.com or Coursera, or whatever. 
  • Build a community of practice for 'scientific computing'. Whether it's a Yammer group or something more formal, be sure to encourage frequent face-to-face meetups, and perhaps an intranet portal.
  • Start to connect subsurface professionals with software engineers, especially web programmers and data scientists, elsewhere in the organization. I think the best way is to embed programmers into technical teams. 
  • Encourage participation in external channels like conferences and publications, data science contests, hackathons, open source projects, and so on. I guarantee you'll see a step change in skills and enthusiasm.

The bottom line is that we're looking for a profound culutral change. It will be slow. More than that, it needs to be slow. It might only take a year or two to get traction for an idea like "digital first". But deeper concepts, like "machine readable microservices" or "data-driven decisions" or "reproducible workflows", must take longer because you can't build that high without a solid foundation. Successfully applying specific technologies like deep learning, augmented reality, or blockchain, will certainly require a high level of technology literacy, and will take years to get right.

What's going on with scientific computing in your organization? Are you 'digitally curious'? Do you feel well-supported? Do you know others in your organization like you?


The circuit board image in the thumbnail for this post is by Carl Drougge, licensed CC-BY-SA.

No more rainbows!

"the rainbow color map can significantly reduce a person’s accuracy and efficiency"
Borkin et al. (2011)

File under "Aaarrrrrrgghhhhhhh"

File under "Aaarrrrrrgghhhhhhh"

The world has known for at least 20 years that the rainbow colourmap is A Bad Thing, perhaps even A Very Bad Thing. IBM researchers Bernice Rogowitz and Lloyd Treinish — whose research on the subject goes back to the early 90s — wrote their famous article Why should engineers and scientists be worried about color? in 1996. Visualization guru Edward Tufte highlighted the problems with it in his 1997 book Visual Explanations (if you haven't read this book, you must buy it immediately). 

This isn't a matter of taste, or opinion. We know — for sure, with science! — that the rainbow is a bad choice for the visualization of data. And yet people use it every day, even in peer-reviewed literature. And — purely anecdotally — it seems to be especially rife in geoscience <citation needed>.

Why are we talking about this? 

The rainbow colourmap suffers from a number of severe problems:

  • It's been linked to inferior image interpretation by professionals (Borkin et al 2011).

  • It introduces ambiguity into the display: are we looking at the data's distribution, or the colourmap's?

  • It introduces non-existent structure into the display — notice the yellow and cyan stripes, which manifest as contours:

rainbow.png
  • Colourblind people cannot read the colours properly — I made this protanopic simulation with Coblis

rainbow_protanope.png
  • It does not have monotonically increasing lightness, so you can't reproduce it in greyscale.

rainbow_grey.png
  • There's no implicit order to hues, so it's hard to interpret meaning intuitively.

  • On a practical note, it uses every available colour, leaving you none for annotation.

For all of these reasons, MATLAB and Matplotlib no longer use rainbow-like colourmaps by default. And neither should you.

But I like rainbows!

People tend like things that are bad for them. Chris Jackson (Imperial, see here and here) and Bert Bril (dGB, in Slack) have both expressed an appreciation for rainbow-like colourmaps, or at least an indifference. Bert went so far as to say he doesn't like 'perceptual' colourmaps — those that monotonically and linearly increase in brightness. 

I don't think indifference is allowed. Research with professional image interpreters has shown us that rainbow colourmaps impair the quality of their work. We know that these colours are hard for colourblind people to use. The practical issues of not being readable in greyscale and leaving no colours for annotation are always present. There's just no way we can ask, "Does it matter?" — at least not without offering some evidence that goes beyond mere anecdote.

I think what people like is the colour variance — it acts like contours, highlighting subtle features in the surface. Some of this extra detail is probably noise, but some is certainly signal, maybe even opportunity. 

See what you think of these renderings of the seafloor pick on the Penobscot dataset, offshore Nova Scotia (licensed CC-BY-SA by dGB Earth Sciences and The Government of Nova Scotia). The top row are some rainbow-like colourmaps, all bad. The others are a selection of (more-or-less) perceptually awesome colourmaps. The names under each map are the names of the colourmaps in Python's matplotlib package.

The solution

We know what kind of colourmaps are good for interpretation: those that increase linearly and monotonically in brightness, with no jumps or stripes of luminance. I've linked to lots of places where you can read about these — see the end of the post. You already know one perceptual colourmap: the humble Greyscale. But there are lots of others, so let's start with one of them.

Next, instead of using something that acts like contours, let's try using contours!

I think that's a big improvement already. Some tips for contouring:

  1. Make them thin and black, with opacity at about 0.2 to 0.5. Transparency is essential. 

  2. Choose a fairly small interval; use index contours if there are more than about 10.

  3. Label the contours directly on a large map. State the contour interval in the caption.

Let's try hillshading instead:

Also really nice.

Given that this is a water-bottom horizon, I like the YlGnBu colourmap, which resembles the thing it is modeling. (I think this is also a good basis for selecting a colourmap, by the way, all else being equal.)

I must admit I do find a lot of these perceptual colormaps get too dark at the 'low' end, which can make annotation (or seeing contours) hard. So we will fix that with a function (see the notebook) that generates perceptually linear colourmaps.

Now tell me the spectrum beats a perceptual colourmap...

Horizons_faceoff.png

Let's check that it is indeed colourblind-safe and grey-safe:

Horizons_faceoff_protanope.png
Horizons_faceoff_grey.png

There you have it. If you care about your data and your readers, avoid rainbow-like colourmaps in the lab and in publications. Go perceptual!

The Python code and data to generate these images is available on GitHub.

Binder     Better yet, click here to play with the data right in your browser!

What do you think? Are rainbow colourmaps here to stay? 

References and bibliography

Still not convinced?

For goodness sake, just listen to Kristin Thyng for 20 minutes: